


What Really Drives Crypto Cycles
What Really Drives Crypto Cycles
Why Bitcoin’s long-term price charts look bearish, the key catalyst for a rally, and the top stories moving the markets

This report covers:
Why Bitcoin’s long-term price charts are starting to look bearish
The key catalyst we need to get the next crypto rally
The top 4 news stories that are moving the markets
Read time: 6 minutes
Summary:
Technicals: Bearish. Bitcoin’s monthly chart is pulling back from a major resistance zone that starts at $30K. The weekly chart failed to sustain a break out above $30.3K. Both are still in an uptrend but starting to look bearish.
Fundamentals: Bearish. The Fed is still fighting inflation by hiking interest rates. There’s no sign of money printing starting again any time soon. There was another DeFi hack (Curve), further degrading trust and disproving utility. We need a better monetary system, better banking systems, and a decentralized internet, but the current iteration of the crypto industry ain’t it.
Sentiment: Bearish. There’s near universal belief amongst crypto natives that there will be another bull cycle like the last ones. Sentiment is a counter-indicator, so this makes me bearish.
My game plan: As a long-term investor who doesn’t want to be staring at the screen all day, my game plan is to wait for a crash to $14K or a rally to $35K before re-entering the market (unless fundamentals improve).
Technical Analysis: What The Long-Term Charts Say
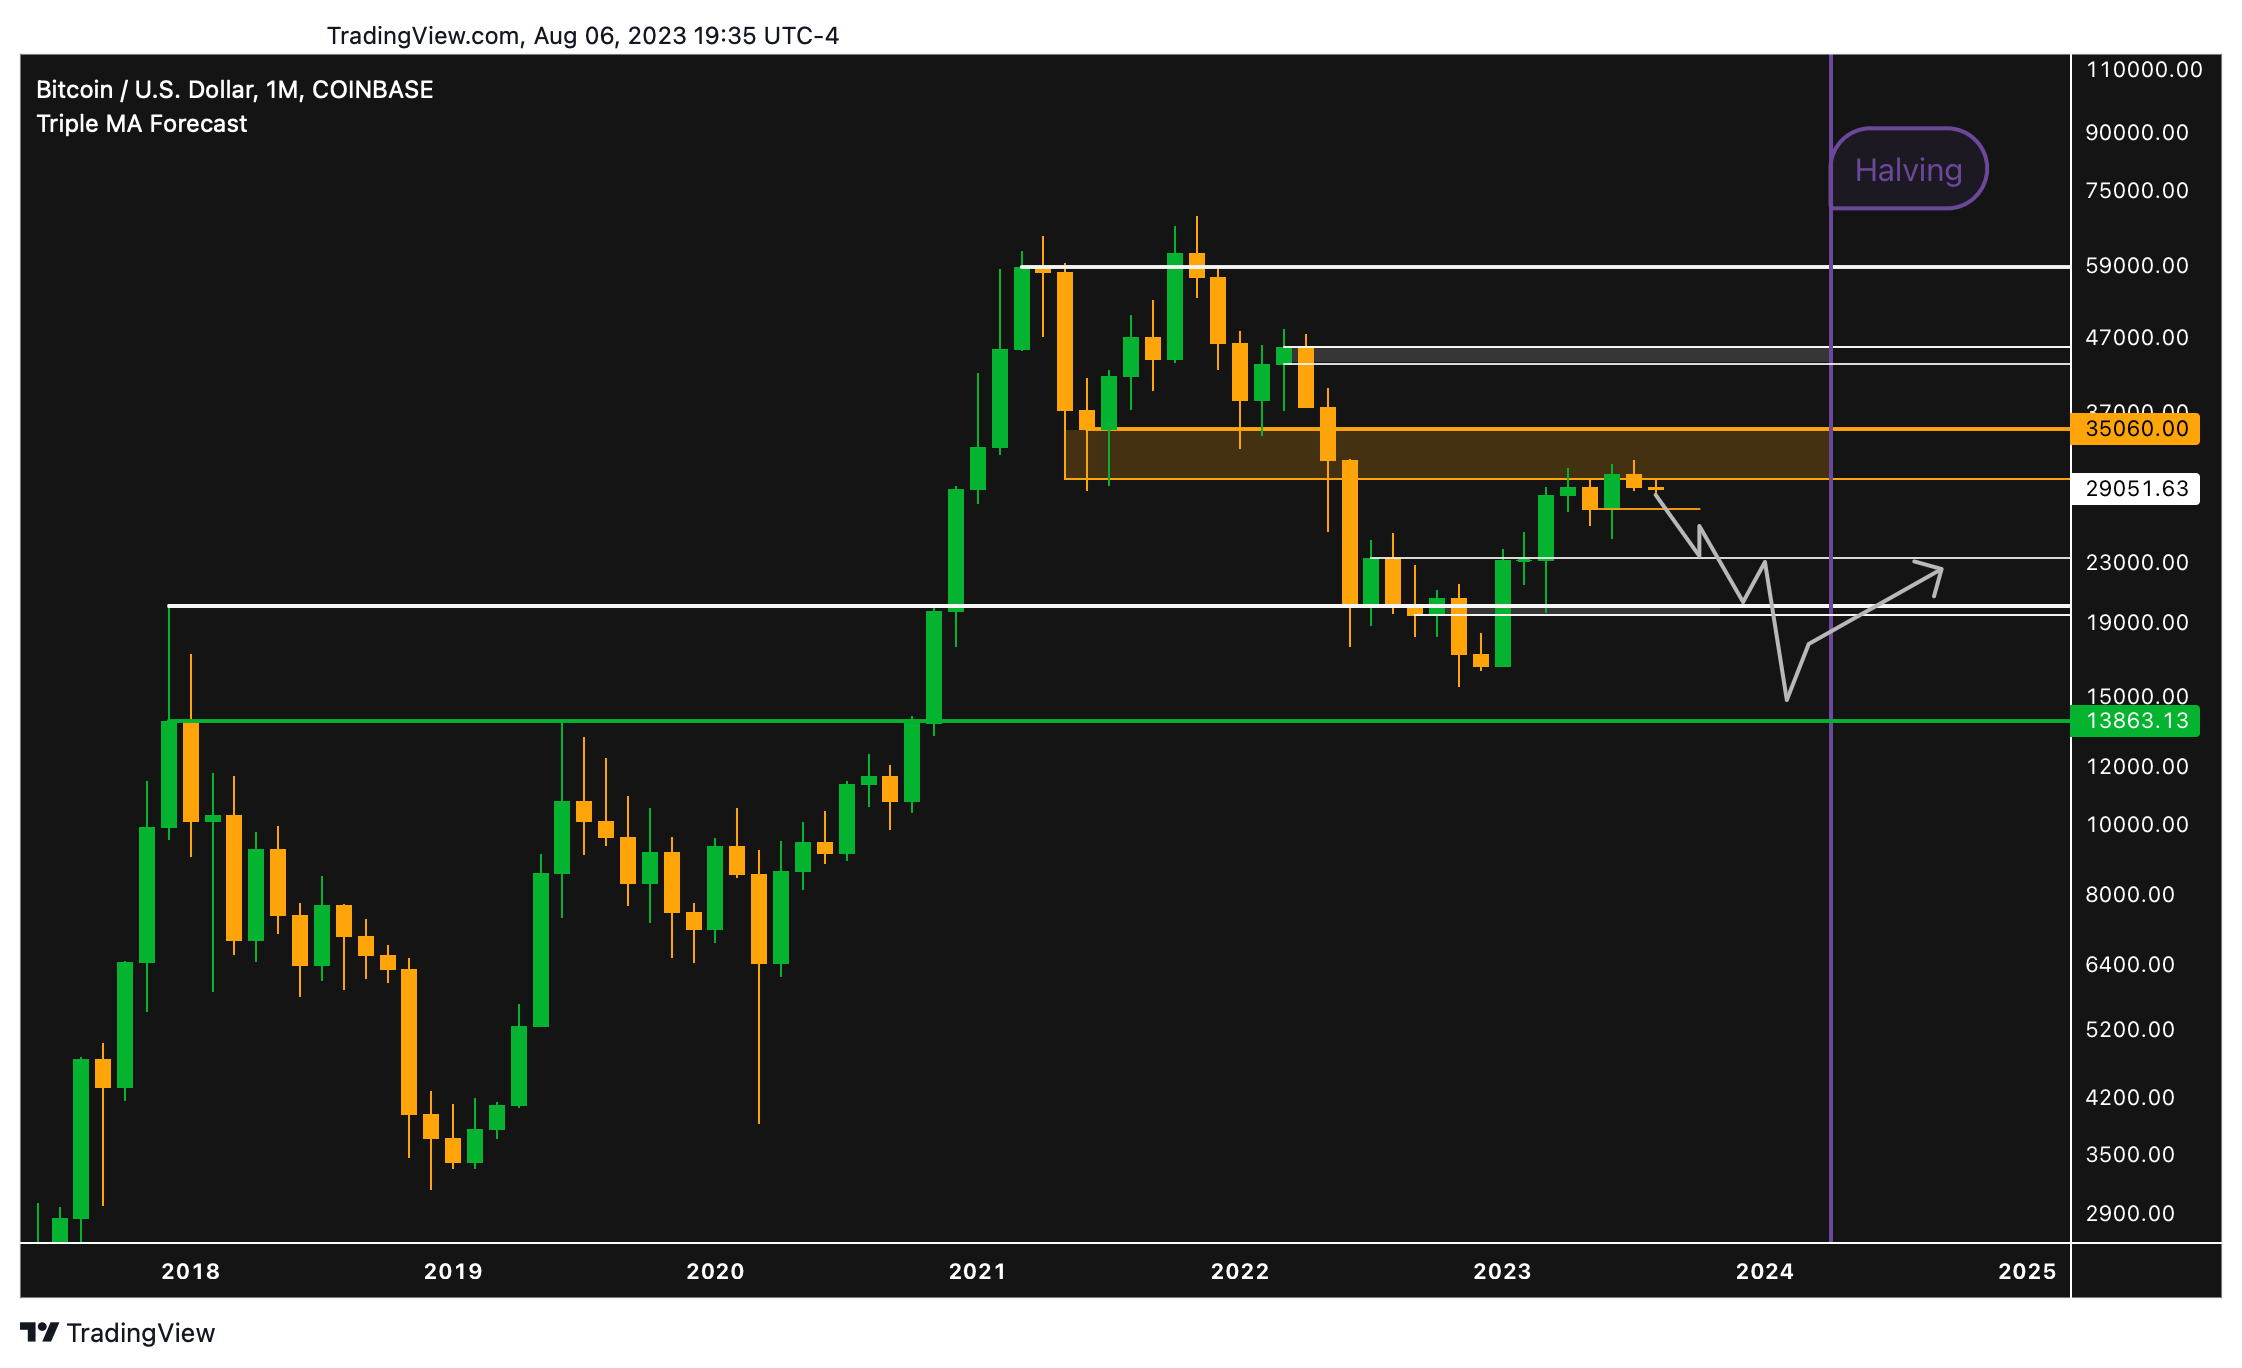
Bitcoin’s monthly chart (above) is still in an uptrend. That’s bullish.
However, last month’s candle got rejected by the resistance zone that starts at $30K. This zone is marked with an orange box in the chart above.
If Bitcoin goes below $27,225 (thin, short orange line), I'd be long-term bearish.
Bulls would need to hope that $20K provides support again. It could, but I don’t plan to buy there (if it goes there).
I’d be interested in buying $14K (green line) if it gets there.
The grey arrow lines in the charts above and below are my worst-case scenario.
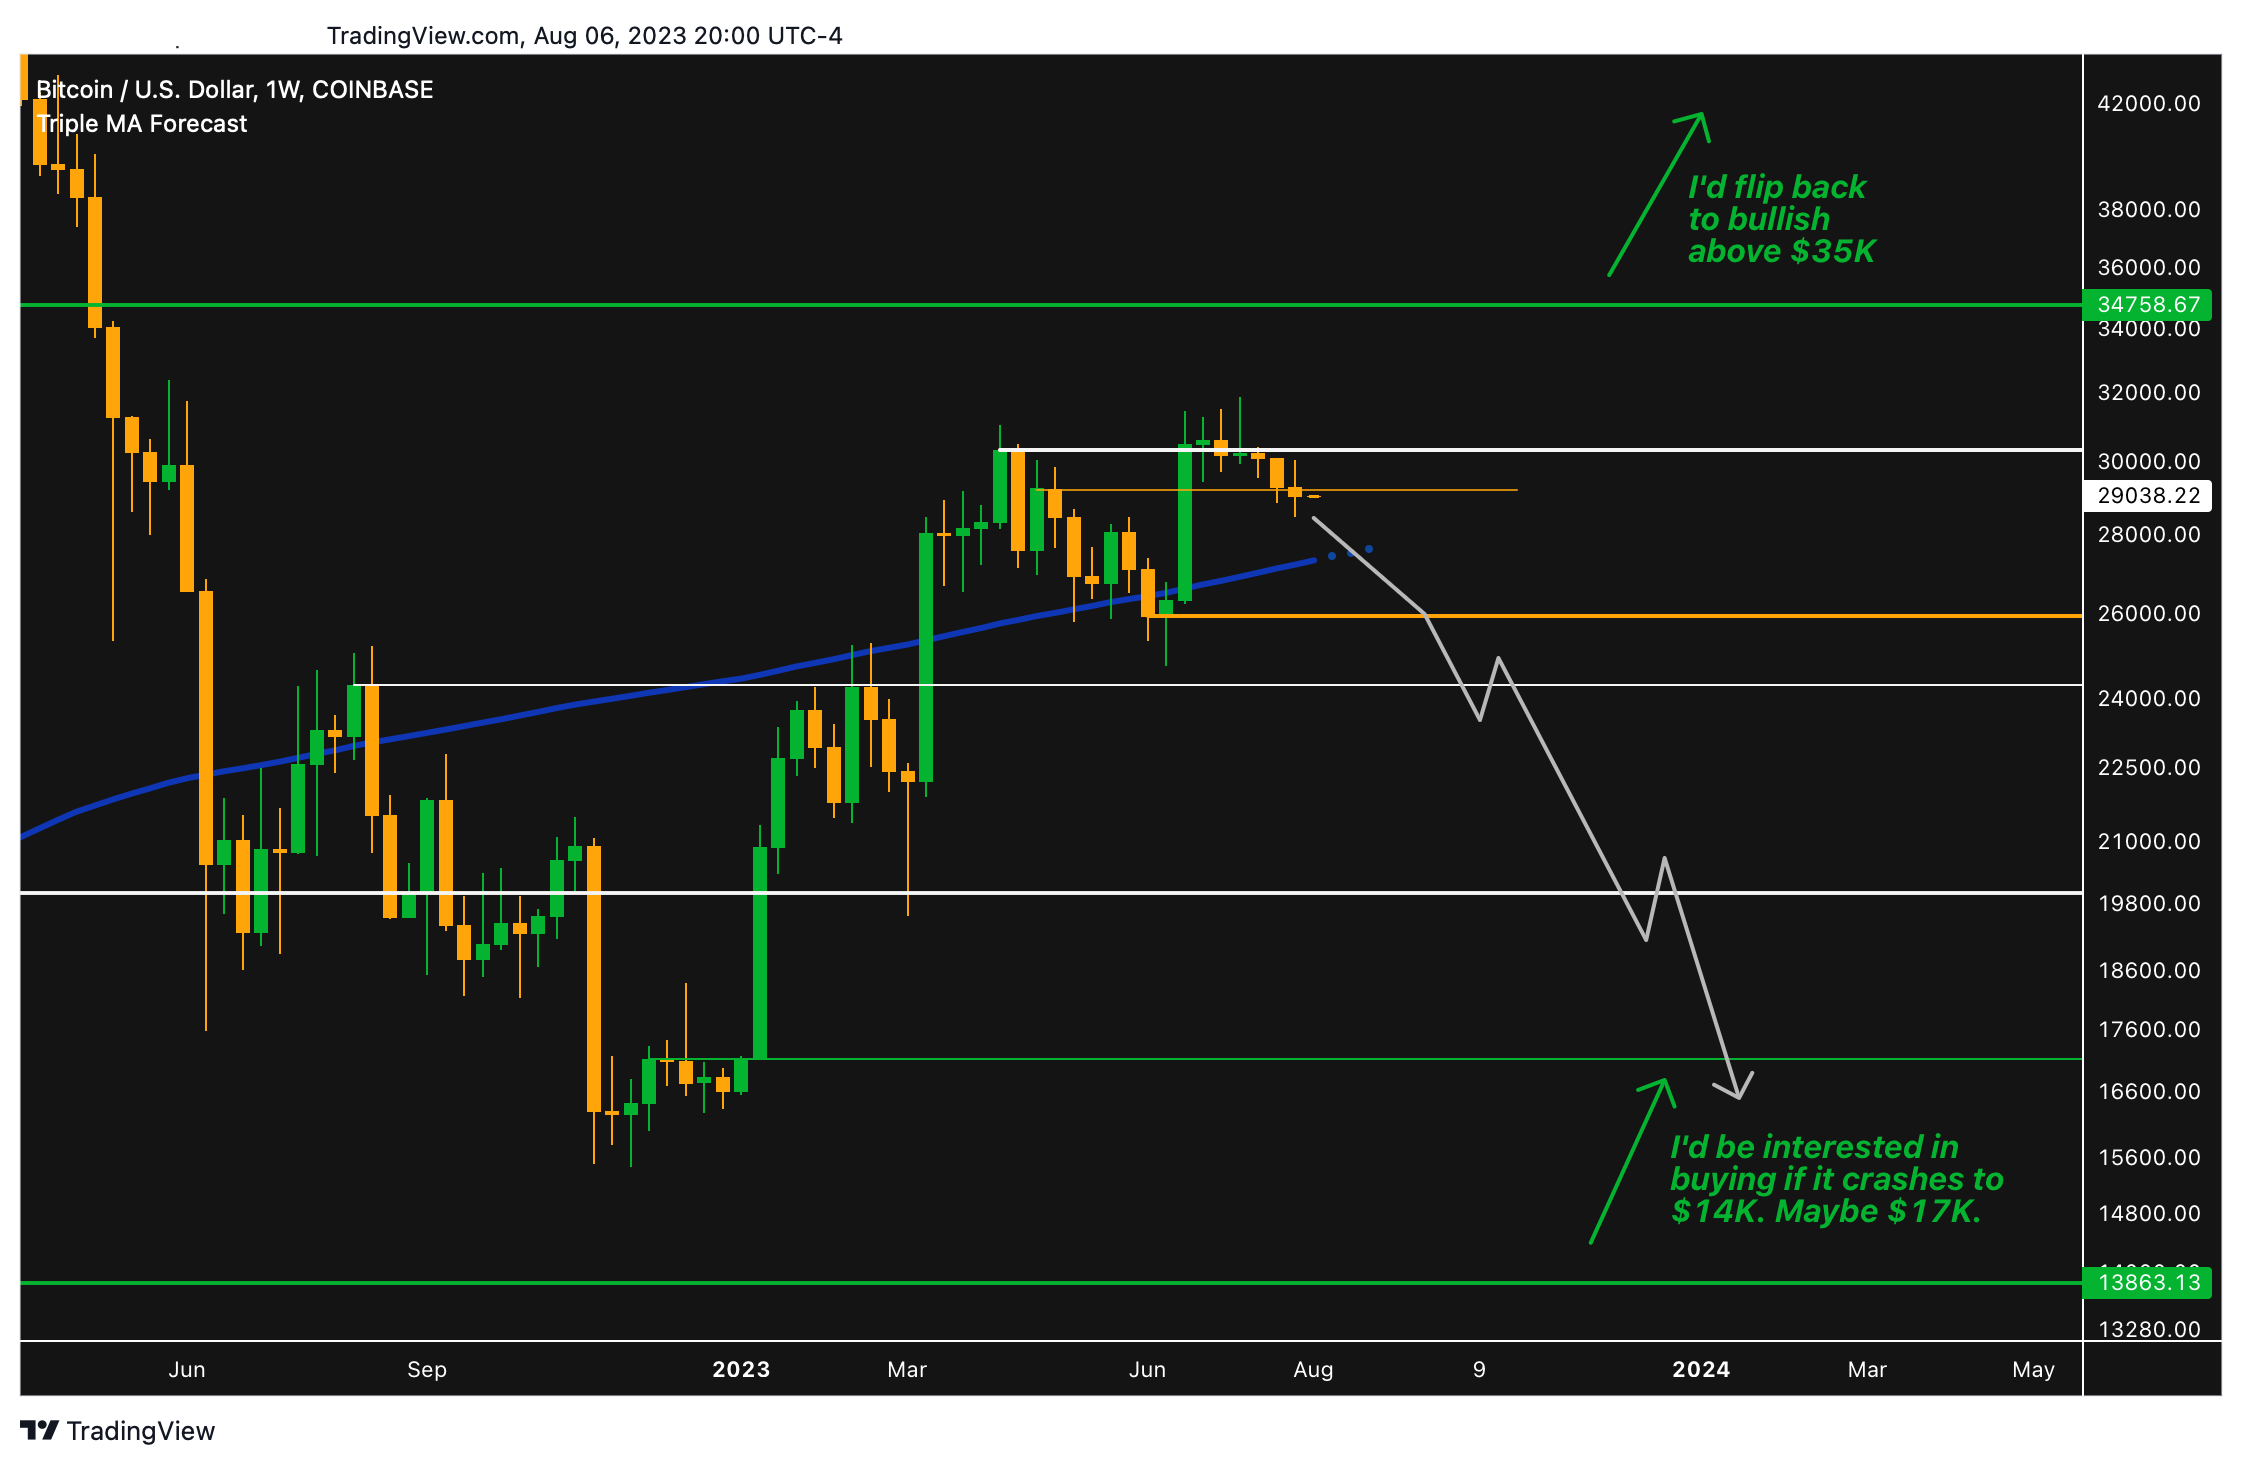
Here’s the bullish case for the weekly chart (above):
In an uptrend: making higher-highs and higher-lows.
Above the 200-week moving average (blue line) and the 200WMA is trending up.
Here’s the bearish case for the weekly chart:
Not seeing follow-through strength after tremendous good news (BlackRock ETF filing, Fink shilling crypto on CNBC, XRP not a security, etc.). Crypto is not pumping.
Failed to break out above the April high at $30.3K
If Bitcoin goes below the orange line at $26K, making a lower-lower, I’d be super bearish.
There aren’t any compelling bullish fundamental or technical catalysts in the near-term horizon for crypto. The market is in hard mode right now. When normies are fomo-buying tops and panic-selling bottoms, it’s easy mode. I’d rather wait until easy mode starts than try to front run it.
My game plan is to sit back and wait and see if crypto crashes again to $14K (maybe $17K). I don’t think this is likely to happen though.
The only fundamental catalysts that would make me interested in buying sooner are if the Fed starts lowering interest rates agressively or if the money printers get turned back on.
Fundamental Analysis: What Really Drives Crypto Prices
There’s near universal belief amongst crypto natives that there will be another bull cycle like the last ones. Most justify this forecast based on one or more of the following:
BlackRock’s spot Bitcoin ETF will open the floodgates to investors who want to invest in crypto but haven’t because they haven’t had a spot ETF
Bitcoin’s next new supply halving is expected to take place in April ‘24
Forecasting models that are based on the assumption that crypto will continue to perform like it has in the past. For example, it has had boom and bust cycles in the past so therefore it will in the future and it will continue to happen in similar phases and timelines.
Here’s my cynical debunk of these proposed catalysts:
First off, Bloomberg ETF Analysts have set their odds of a spot Bitcoin ETF approval at 65%. That’s far from a lock.
Given that this has been the main bullish catalyst lately, disapproval, or even a delayed decision, could be a bearish catalyst.
I also don’t know how many people want to buy Bitcoin but haven’t simply because of a lack of ETFs. They’ve had the opportunity to buy via a variety of means but have chosen not to. If people only want exposure to DeFi if it’s through TradFi, that doesn’t seem like a great sign long-term.
Second, while Bitcoin’s new supply halving did take place in May ‘20, towards the beginning of the last bull cycle, I don’t think it caused the bull run, it was just correlated with it.
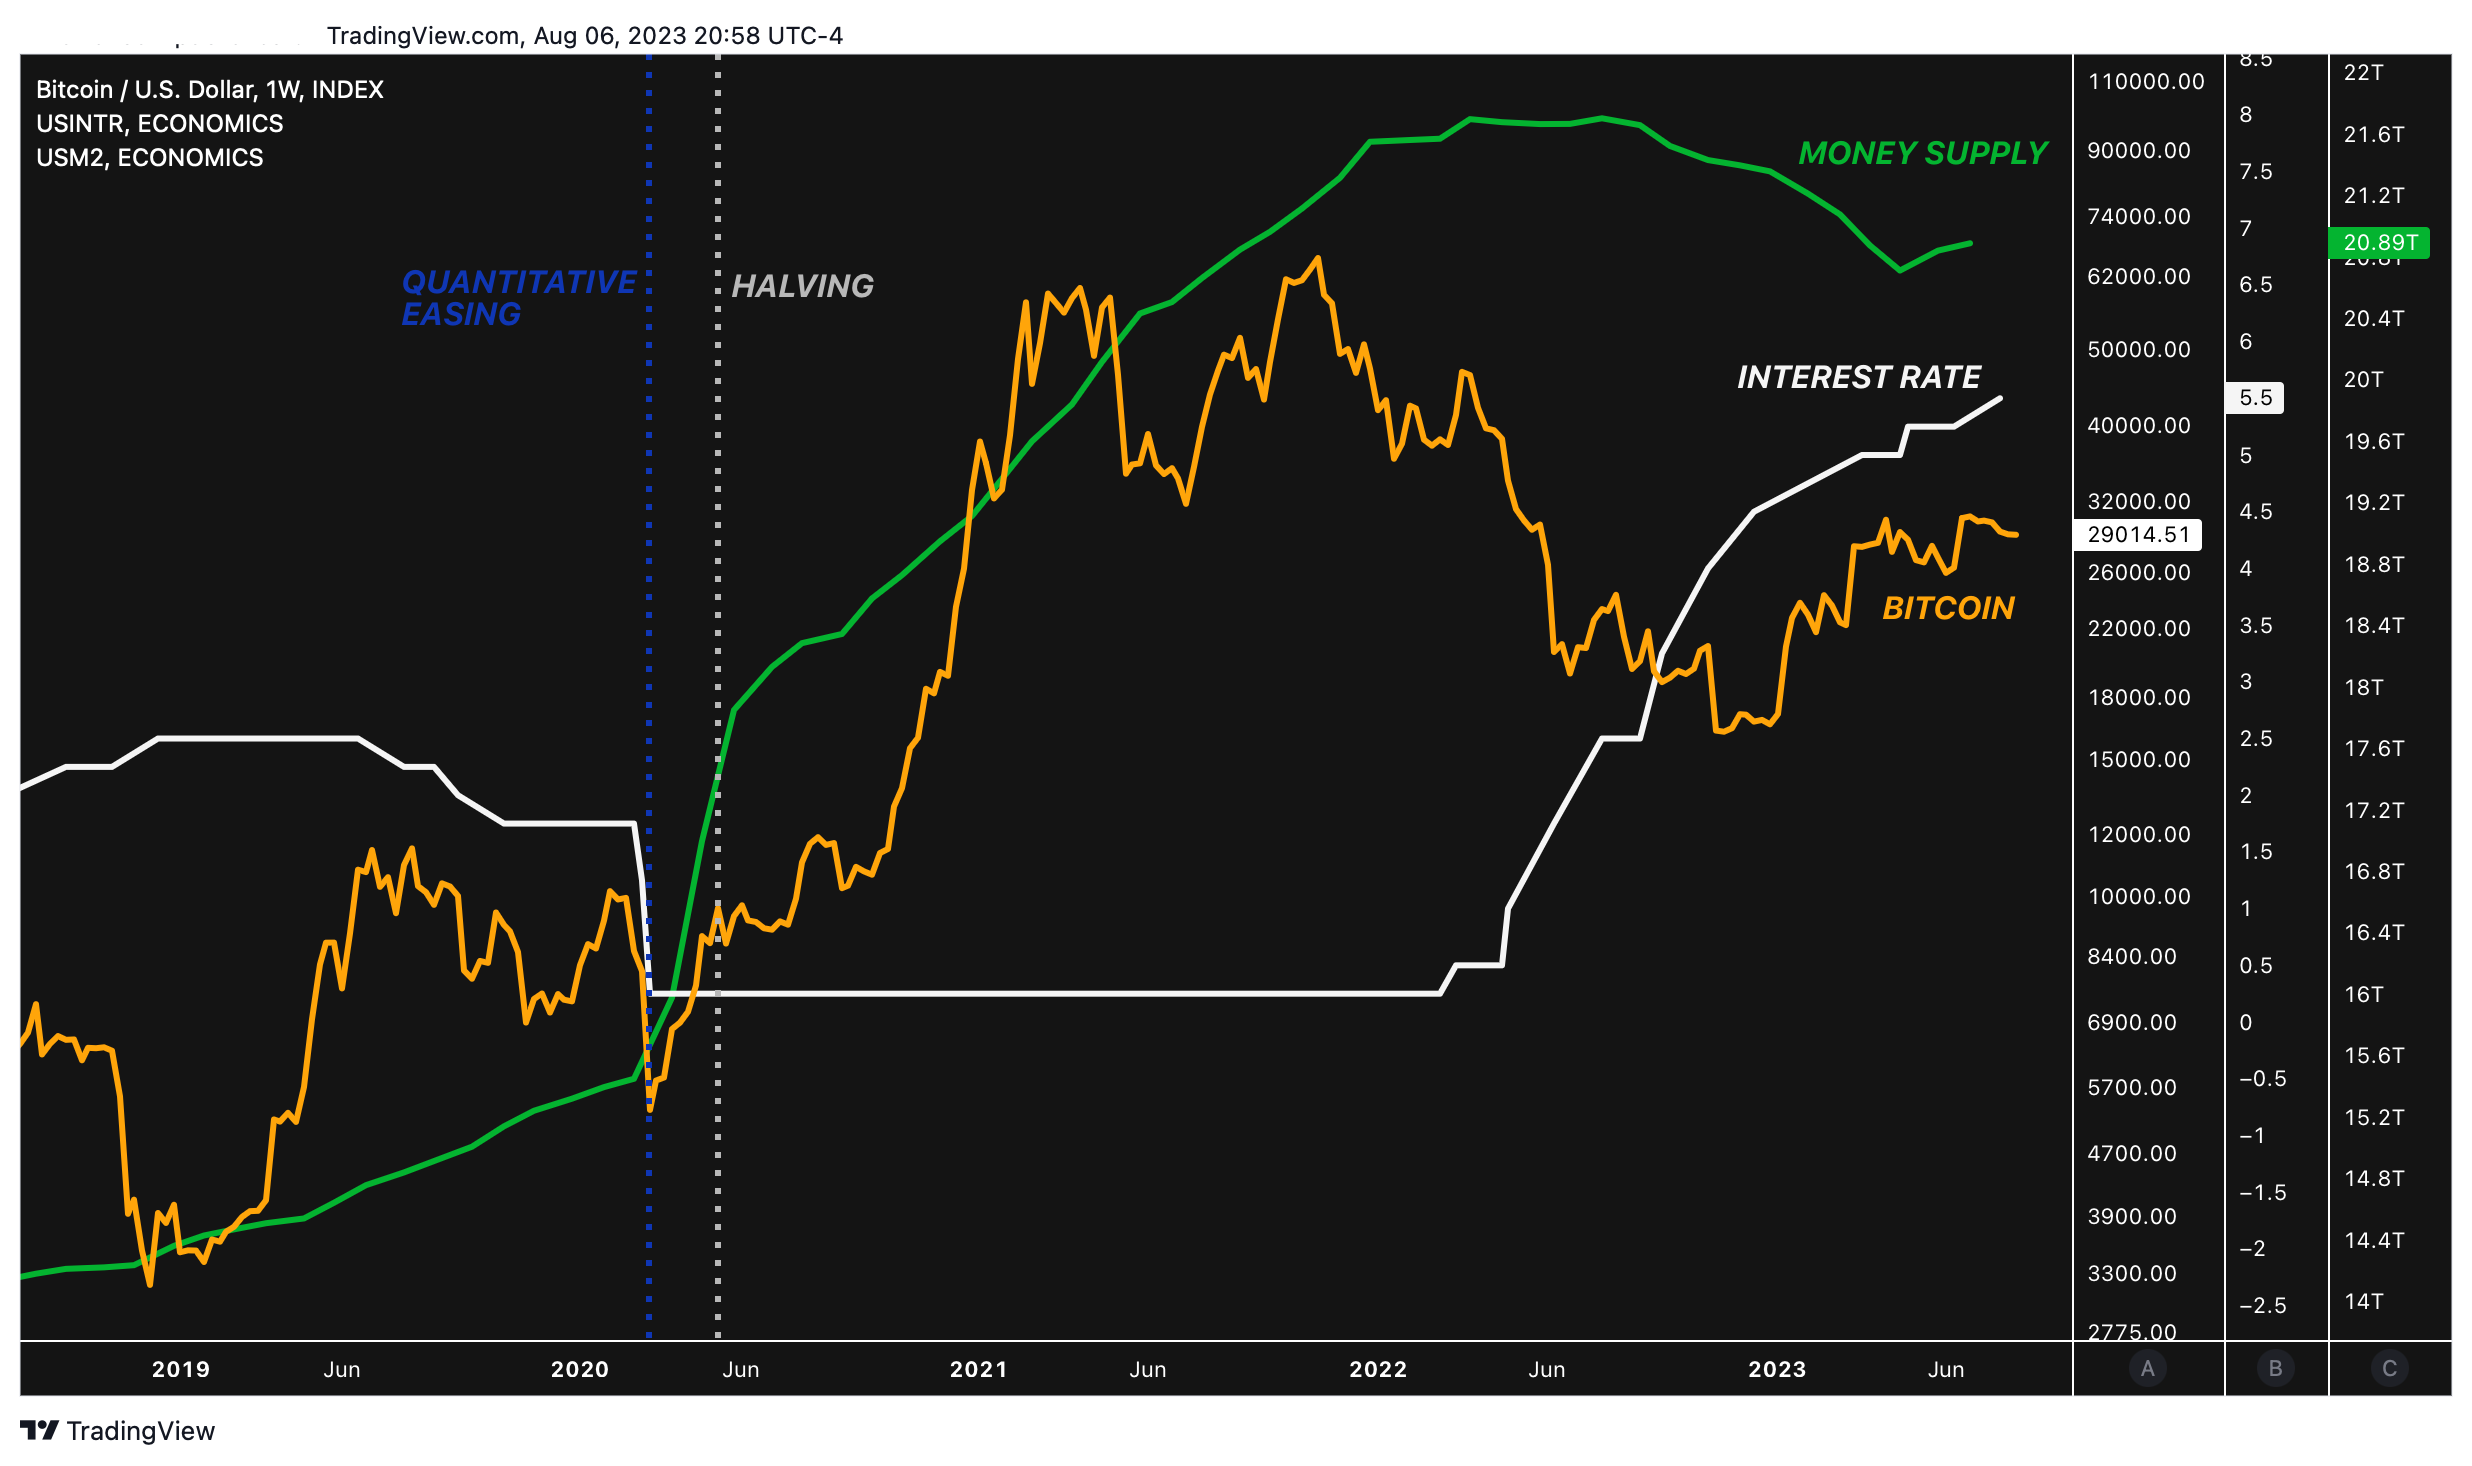
There were a few other things that happened right around the same time:
Historic money printing. This caused inflation and devalued the US Dollar. Bitcoin has been marketed as a hedge against this.
Interest rates down to zero. There was no point in keeping your money out of risk assets when you don’t earn anything for doing so. Then FOMO set in and people went further out on the risk curve into crypto and startups.
The GBTC arbitrage trade. 3AC and others borrowed money from crypto banks to pile into GBTC when it was trading at a premium. This caused Grayscale to buy massive amounts of Bitcoin. The last cycle was fueled by a huge amount of leverage that isn’t available anymore.
Since those crazy times, The Fed hiked interest rates from 0 to 5.25%, the money printers have been turned off, GBTC has traded down to a discount, and the major crypto banks collapsed. Crypto prices have suffered in this environment.
It’s difficult to predict if or when quantitative easing will start back up again. The economy and the banks are holding up just fine so far despite some prior bumps in the road and inflation is still high.
Top Stories Moving the Markets
Michael Saylor and MicroStrategy continue hoarding Bitcoin. Between April 29 ‘23 and June 27 ‘23, MicroStrategy acquired approximately 12,333 bitcoins for approximately $347.0 million in cash. The company bought another 467 BTC in July for around $14.5 Million. Is Saylor single handedly keeping the market afloat?
Curve got hacked for around $60 million. In addition, Founder, Michael Egorov had borrowed over $100m in stablecoins on various DeFi lending protocols using his CRV as collateral. He’s rumored to have spent most of it on illiquid assets like mansions. This is yet another lesson for the crypto industry on managing counterparty risk and not accepting volatile assets as collateral. DeFi’s yield to risk relative to TradFi is simply not favorable right now. Total Value Locked is down from a high of $175 billion to $40 billion.
Fitch Downgraded the United States' Long-Term Ratings to 'AA+' from 'AAA'. The ratings agency expects US general government debt-to-GDP ratio to rise to 118.4% by 2025. That's over two-and-a-half times higher than the 'AAA' median of 39.3% of GDP and 'AA' median of 44.7% of GDP. This sounds bad in theory, but we don't have any meaningful historical precedent to help predict how this will play out in practice. Maybe we'll figure it out—perhaps because of unforeseen events such as superconductors, The Fed maintaining its ability to keep fighting inflation without destroying the economy or banks, etc..
Coinbase’s earnings report last week included two fascinating (bearish) data points. First, the company reported that institutional interest in crypto was down. Coinbase removed special pricing from institutions last quarter to improve margins. Q2 '23 transaction volume for institutions was down 54% compared to Q2 '22. Second, the company is pivoting "towards crypto use cases beyond trading.” Trading volume on Coinbase’s platform fell to $92 billion from $217 billion a year earlier. This signals to me that they don't forecast enough demand for crypto as an investable asset class.
This was a super bearish report. Apologies to my perma-bull homies who read this. I’ll be posting less frequently for the time being. My criteria for making moves is unlikely to be met at all, let alone any time soon. I’ll send updates any time technicals, fundamentals, or sentiment changes in a meaningful way though.