


Crypto's Not Lookin' Too Hot Right Now
Crypto's Not Lookin' Too Hot Right Now
Meme coins pump and good macro news sends markets lower

We got a slew of good economic data this week. Most notably, inflation metrics (PPI and CPI) came in lower than expected.
This is supportive of The Fed’s ability to pause rate hikes without causing hyper inflation. According to the CME Group’s FedWatch tool, interest rate traders expect last week’s rate hike to be the last. They expect easing to start by September.
A pause in rate hikes and the prospect of easing should be good news for Bitcoin.
However, Bitcoin has traded lower this week.
This is a change in regime.
During the 100% rally in Bitcoin over the past few months, bad news was ignored. Price went higher despite fears over recession, contagion in crypto, and the regulatory assault on the industry.
Was the pause in rate hikes one gigantic “buy the rumor, sell the news” event? Everyone knew the Fed would pause hikes eventually, it was just a question of when. Maybe the shift was “priced in”.
Now the market has to wrestle with the potential negative consequences of pausing rate hikes—such as inflation.
In addition, it’s possible that we haven’t yet experienced the full impact of The Fed’s historically rapid rate hikes. This could mean more trouble for regional banks.
Tom Dunleavy shared a chart by BofA that maps past Fed rate hikes to economic disasters.
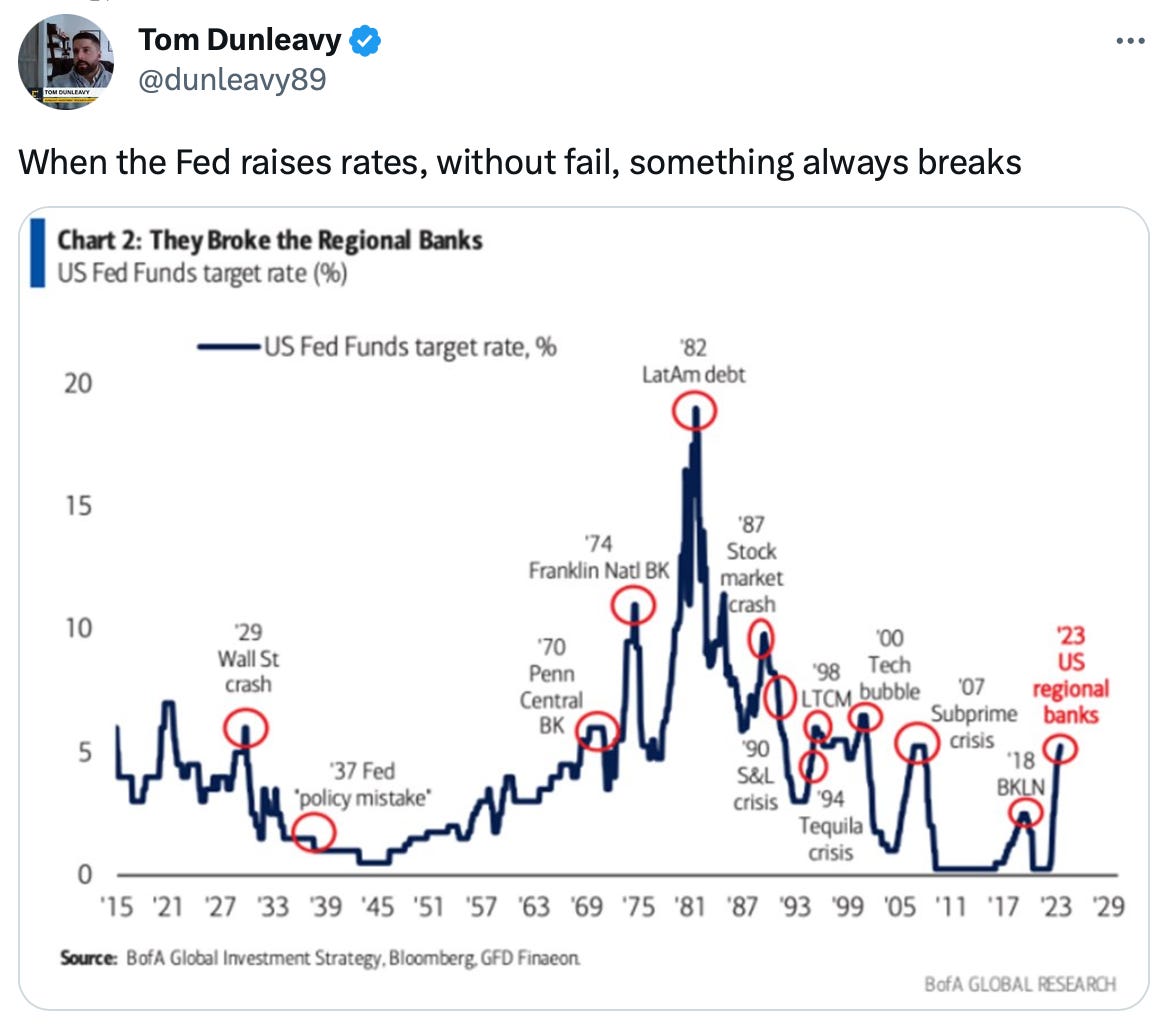
Some people think that a banking crisis would be bullish for Bitcoin. I don’t see it that way. If banks keep failing, people will be in a state of panic. The last thing they’d want to do is put their money in crypto. Maybe it would be bullish in the long-term though.
Now that I’ve covered the fundamentals, let’s dive into some charts to get a game plan for how to play the current market conditions.
TLDR: My Outlook
Short-term (days to weeks): Bearish. After a nice rally over the past several months, Bitcoin ran into a technical zone of resistance.
Medium-term (weeks to months): Neutral. It’s possible that Bitcoin won’t make a higher-high above the recent swing high at $31K until the Fall.
Long-term (months to years): Bullish. If the Fed starts lowering the target rate, it should ultimately be bullish for Bitcoin. In addition, the next halving is forecast to take place in less than a year. This supply reducing event has historically been bullish.
Altcoins look horrible.
Bitcoin: Pulling Back From Resistance
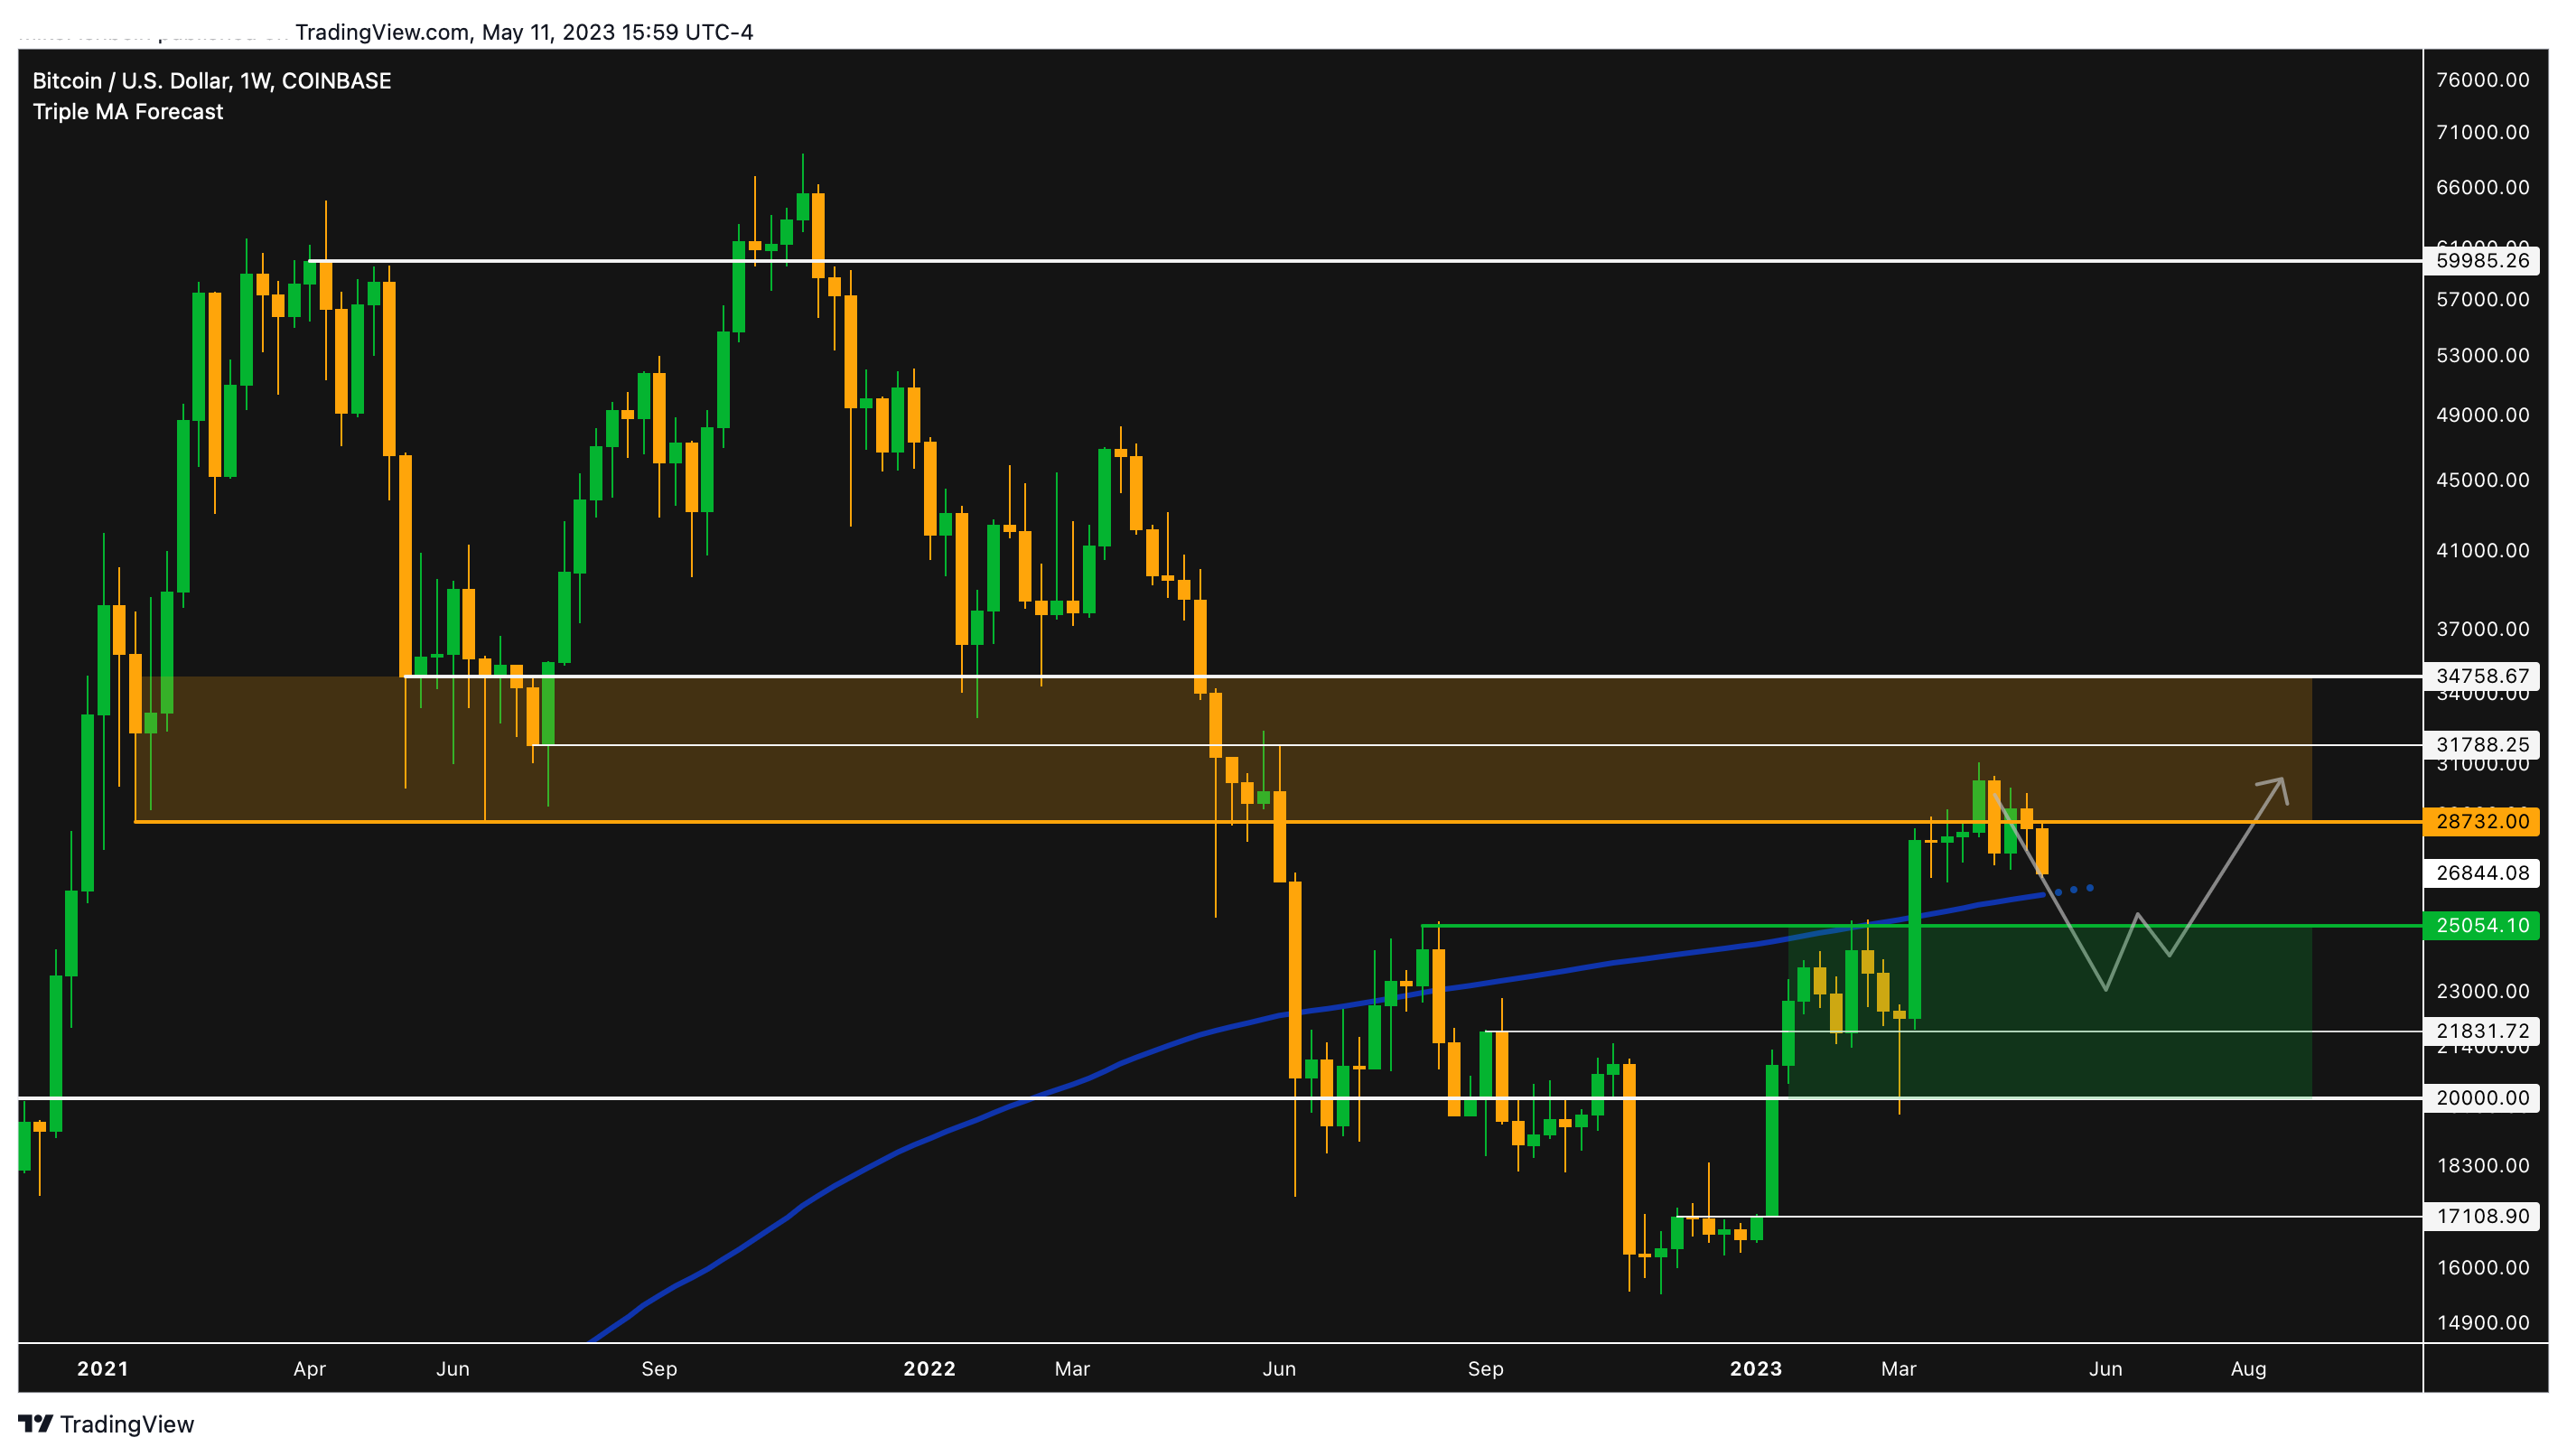
After rallying 100% off of the November lows, Bitcoin ran into a resistance zone (the orange box in the chart above). Price has been chopping around the border of it for the past two months. This has made it difficult to have conviction on short and medium-term price movements.
As of right now, however, it looks like Bitcoin has decided that it wants to trade lower rather than consolidate and/or grind slowly higher.
Fortunately, there is a bunch of support (the green box in the chart above) below the current price that would be logical spots for Bitcoin to form a higher-low and then trade higher.
I think that the best case scenario is that the 200-week moving average (the blue line in the chart above) marks the low for the current dip. That’s currently sitting at about $26K. I think this is a low probability
The worst case scenario in my mind is that Bitcoin goes all the way back down to around $20K. It could even trade as low as $19K for a few hours. I think this is a low probability scenario too.
The most likely scenario, in my opinion, is that Bitcoin goes back down to about $23.3K.
As I’ve been saying for several weeks now, my game plan is to buy at $23.3K or lower or above $35K. I took profit on the majority of the position that I had been building since November at around $29.5K so that I could do so. If I’m wrong and we blast higher and I miss the move to $35K, so be it. I can live with that.
Altcoins Look Horrible
There have been a few meme coin pumps recently. This has historically been a bad sign for crypto markets including Bitcoin and Ethereum.
Aside from those few meme coins, most altcoins look horrible. Here’s the monthly chart of TOTAL3, an index of the total market cap of crypto excluding BTC and ETH.
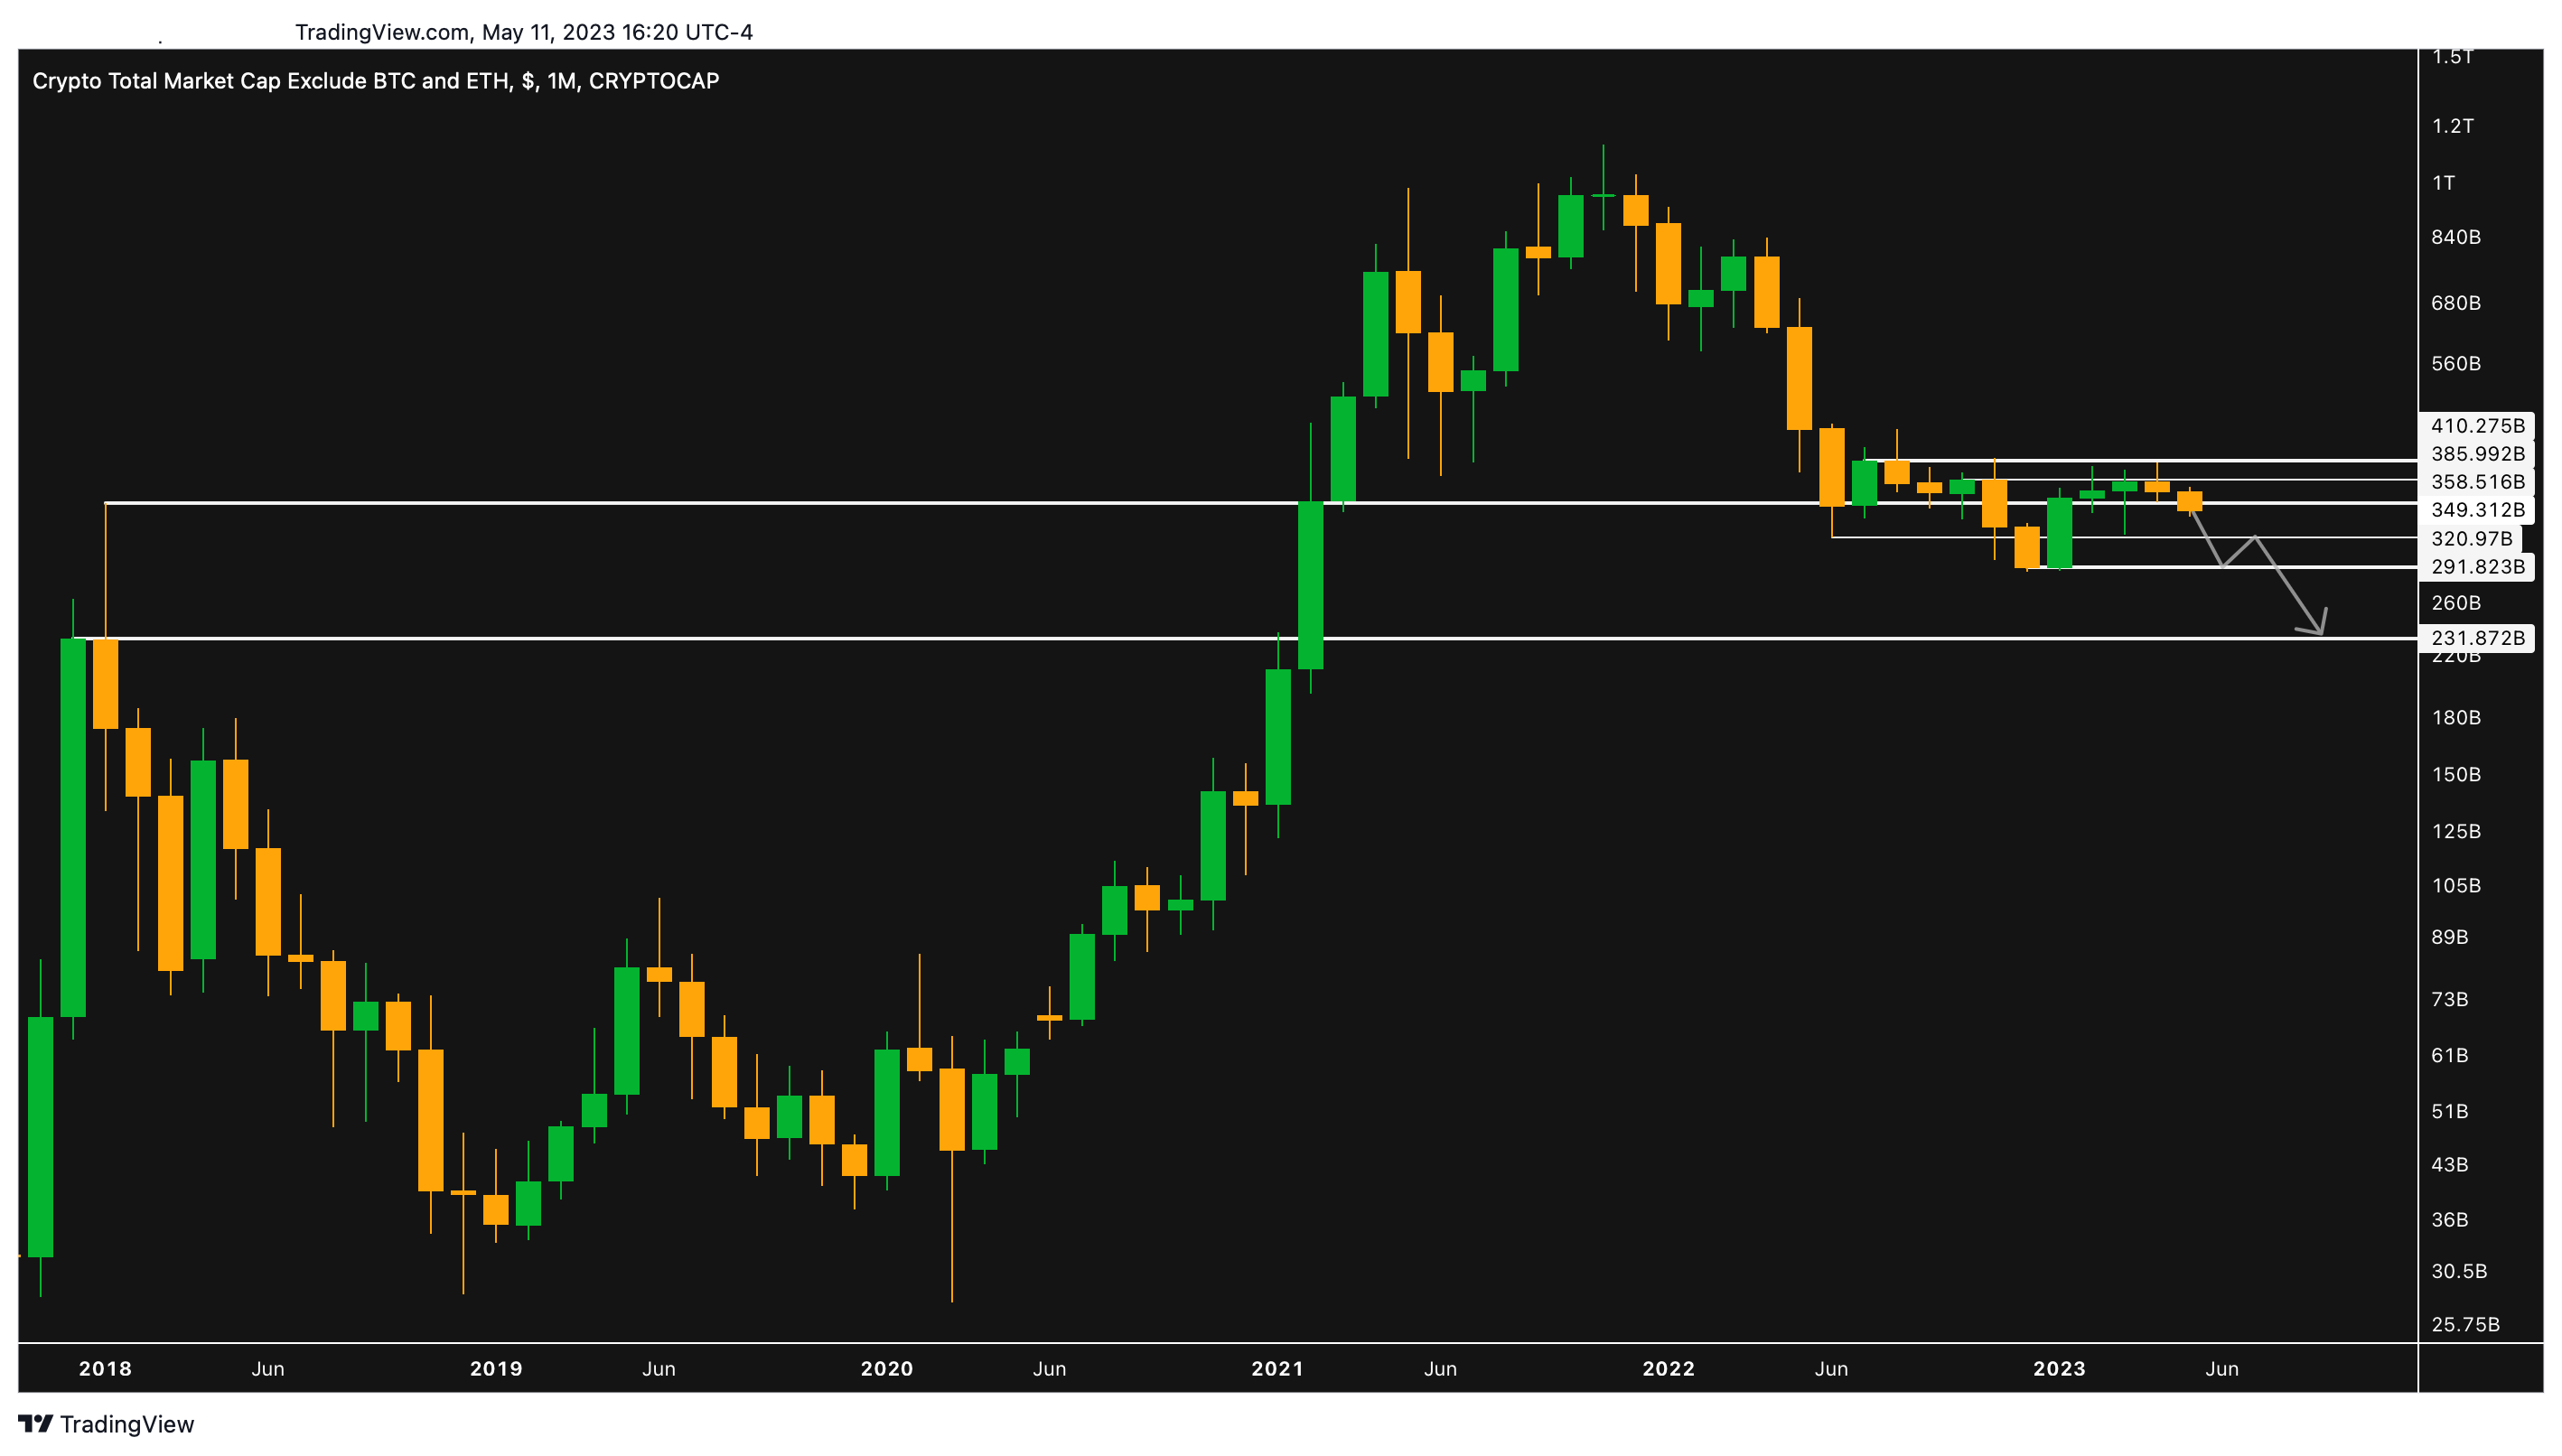
It’s been been flat for the past year. Will bag holders finally lose patience and capitulate?
Zooming out, it’s still in a downtrend (making a series of lower-highs and lower-lows) since the last bull market and is now breaking down from the 2017 high resistance level. Not good!

The weekly chart has given two massively bearish signals lately. First, when it failed to sustain a higher-high break out. Second, when it broke down from the 200- and 50-week moving averages while the 50-week is crossing below the 200.
Even Ethereum doesn’t look too hot relative to Bitcoin:
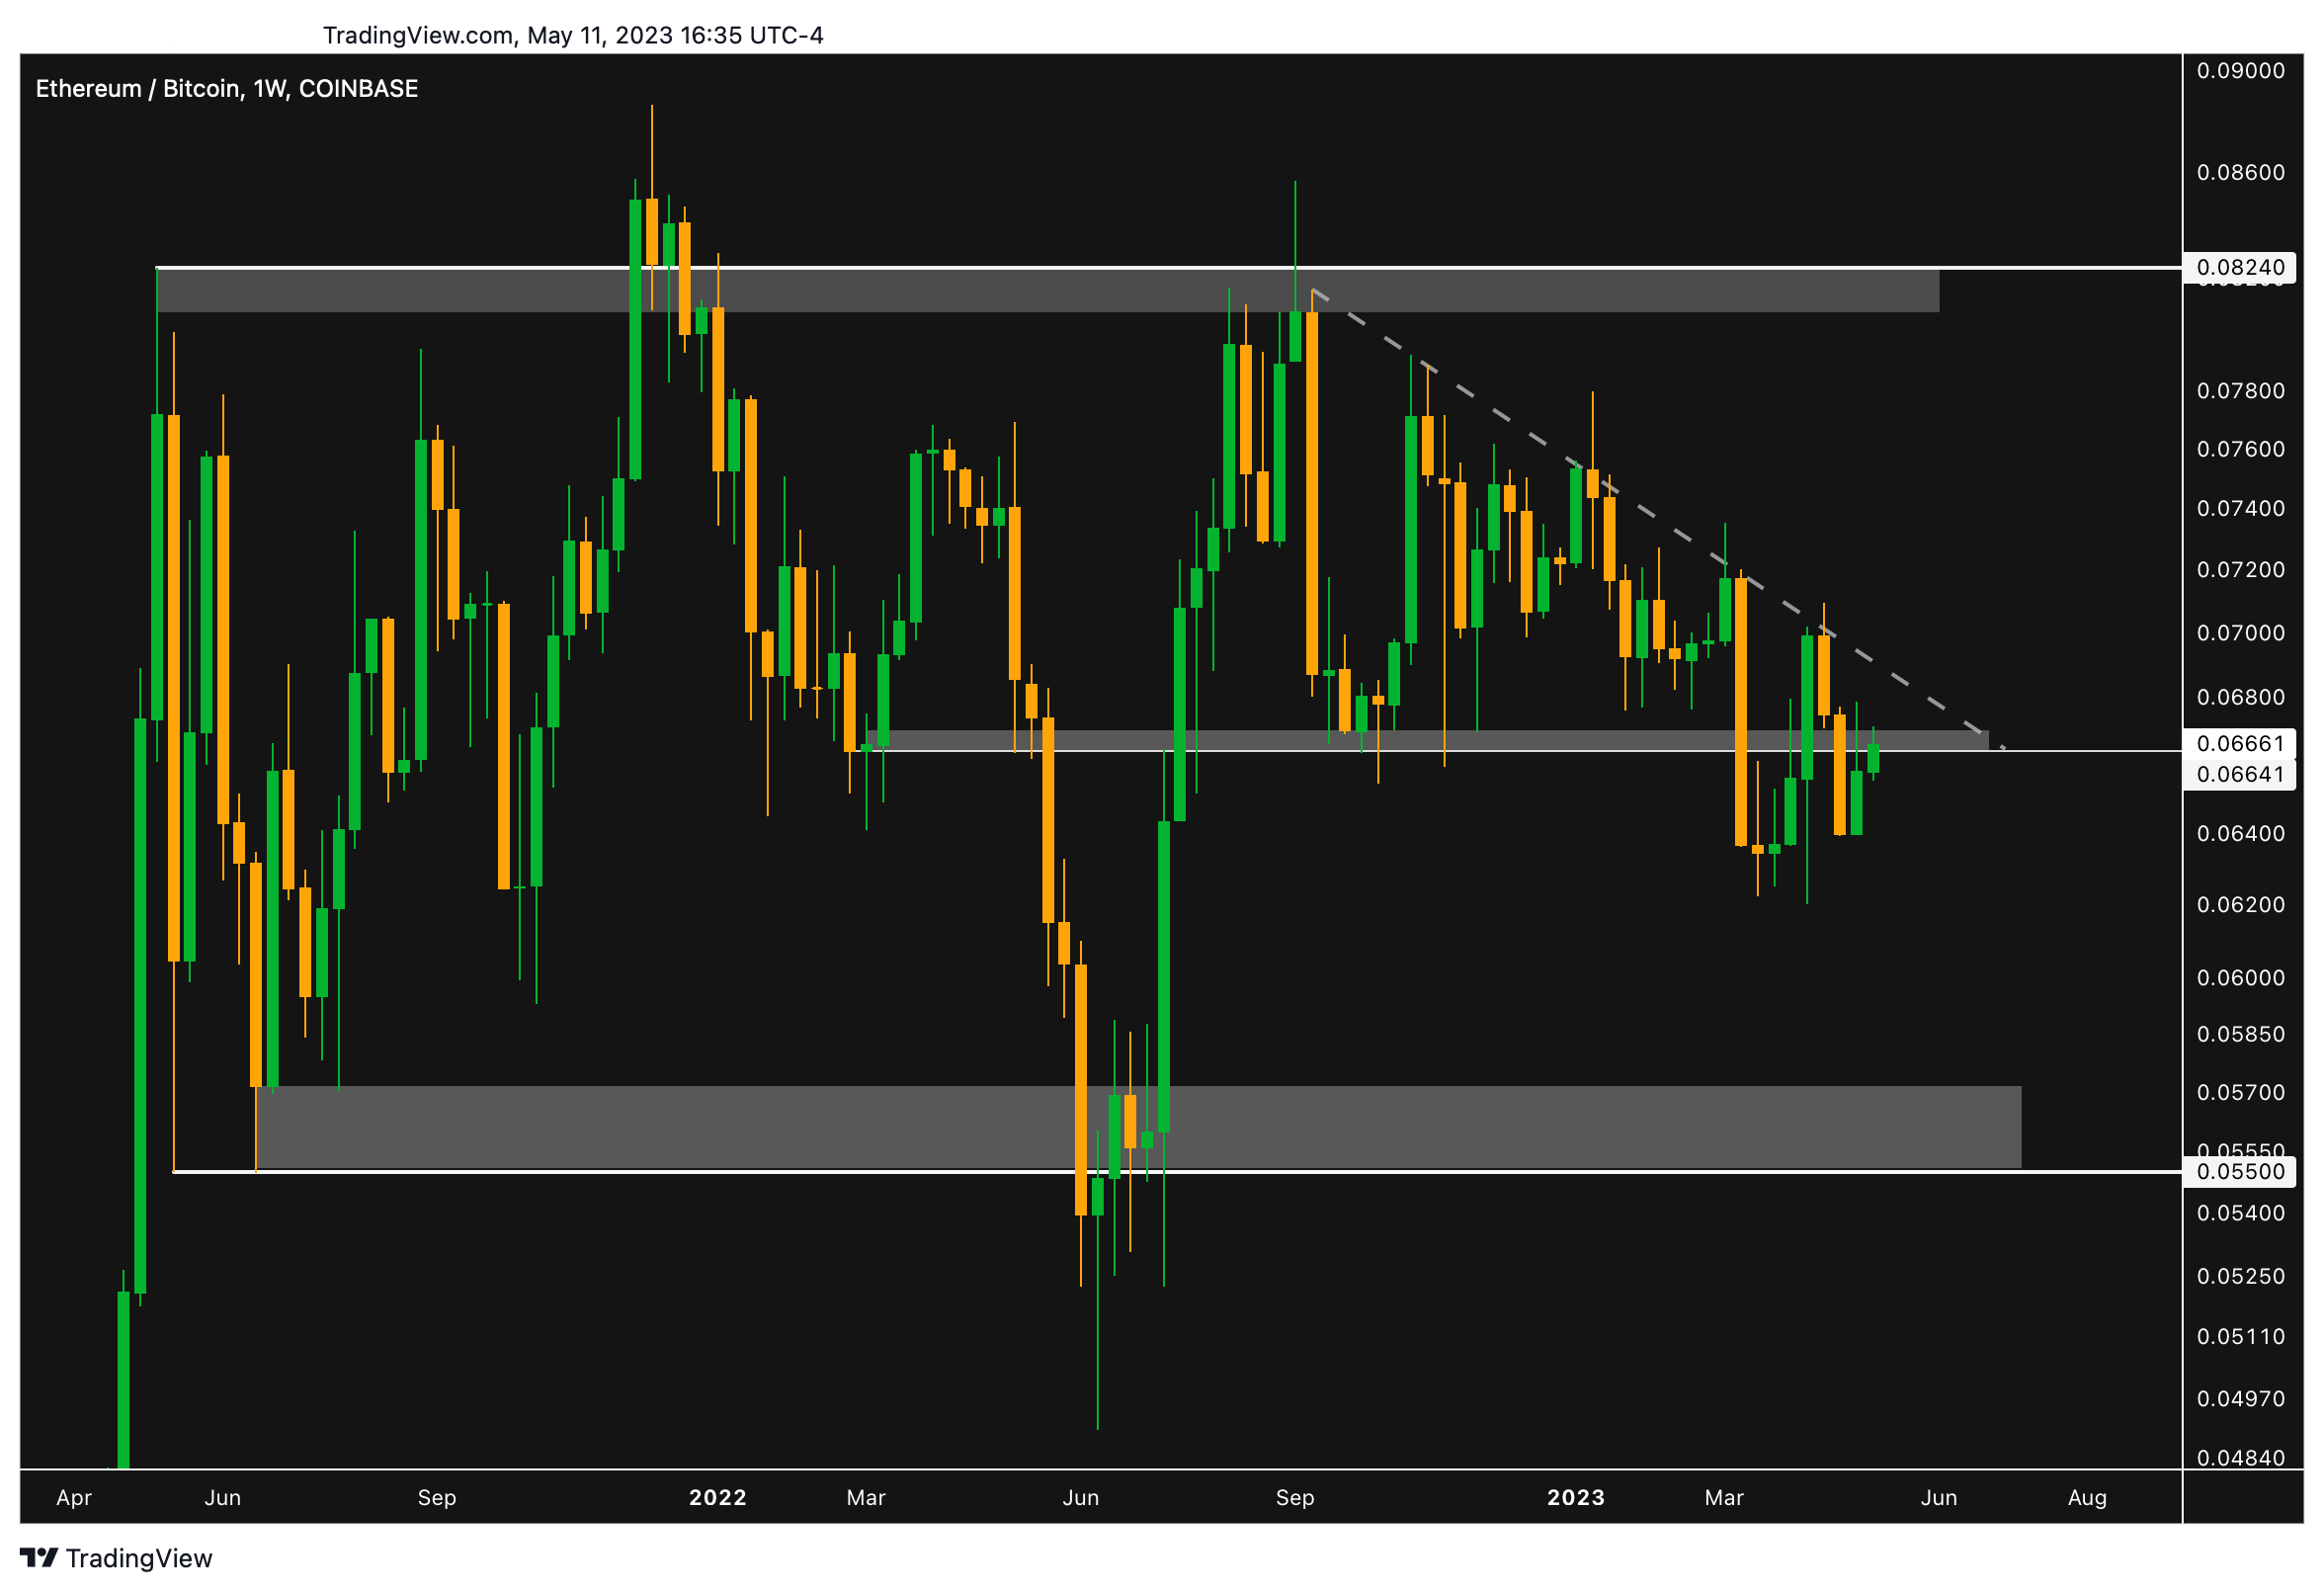
The ETH/BTC weekly chart (above) has been in a downtrend since September.
A number of individual alt charts have looked bad for several weeks now including Ethereum layer 2s, Polygon (MATIC) and Optimism (OP), and DeFi coins.
It would be healthy for alts to continue to pull back. We need to flush out more of the garbage projects and the traders who are only here to make a quick buck.
The meme coins that were pumping have recently started dumping. That’s a good start.