

Is Bitcoin Finally Ready for a Major Pull Back?
My game plan for this week and beyond

Bitcoin doubled in price over the past five months, but it’s been flat over the past five days and started showing weakness over the weekend.
Is a larger pullback in order? And if so, would it change my longer-term bullishness?
In this issue, I look at the stock market and the US dollar to get clues on where Bitcoin might be headed, then check out Ethereum and form a game plan for how to play a pullback if there is one.
Here’s the TLDR: Bitcoin is at a major medium-term resistance zone based on the weekly chart. In addition, the S&P 500 is at resistance, and the US Dollar is at support. I took profits on a small amount of my Bitcoin today. If crypto does pull back, I’m looking to put that cash back into Ethereum if it continues to show strength. If Bitcoin continues higher, I’ll put that cash back in at above $35K.
Bitcoin Long-Term: Bullish
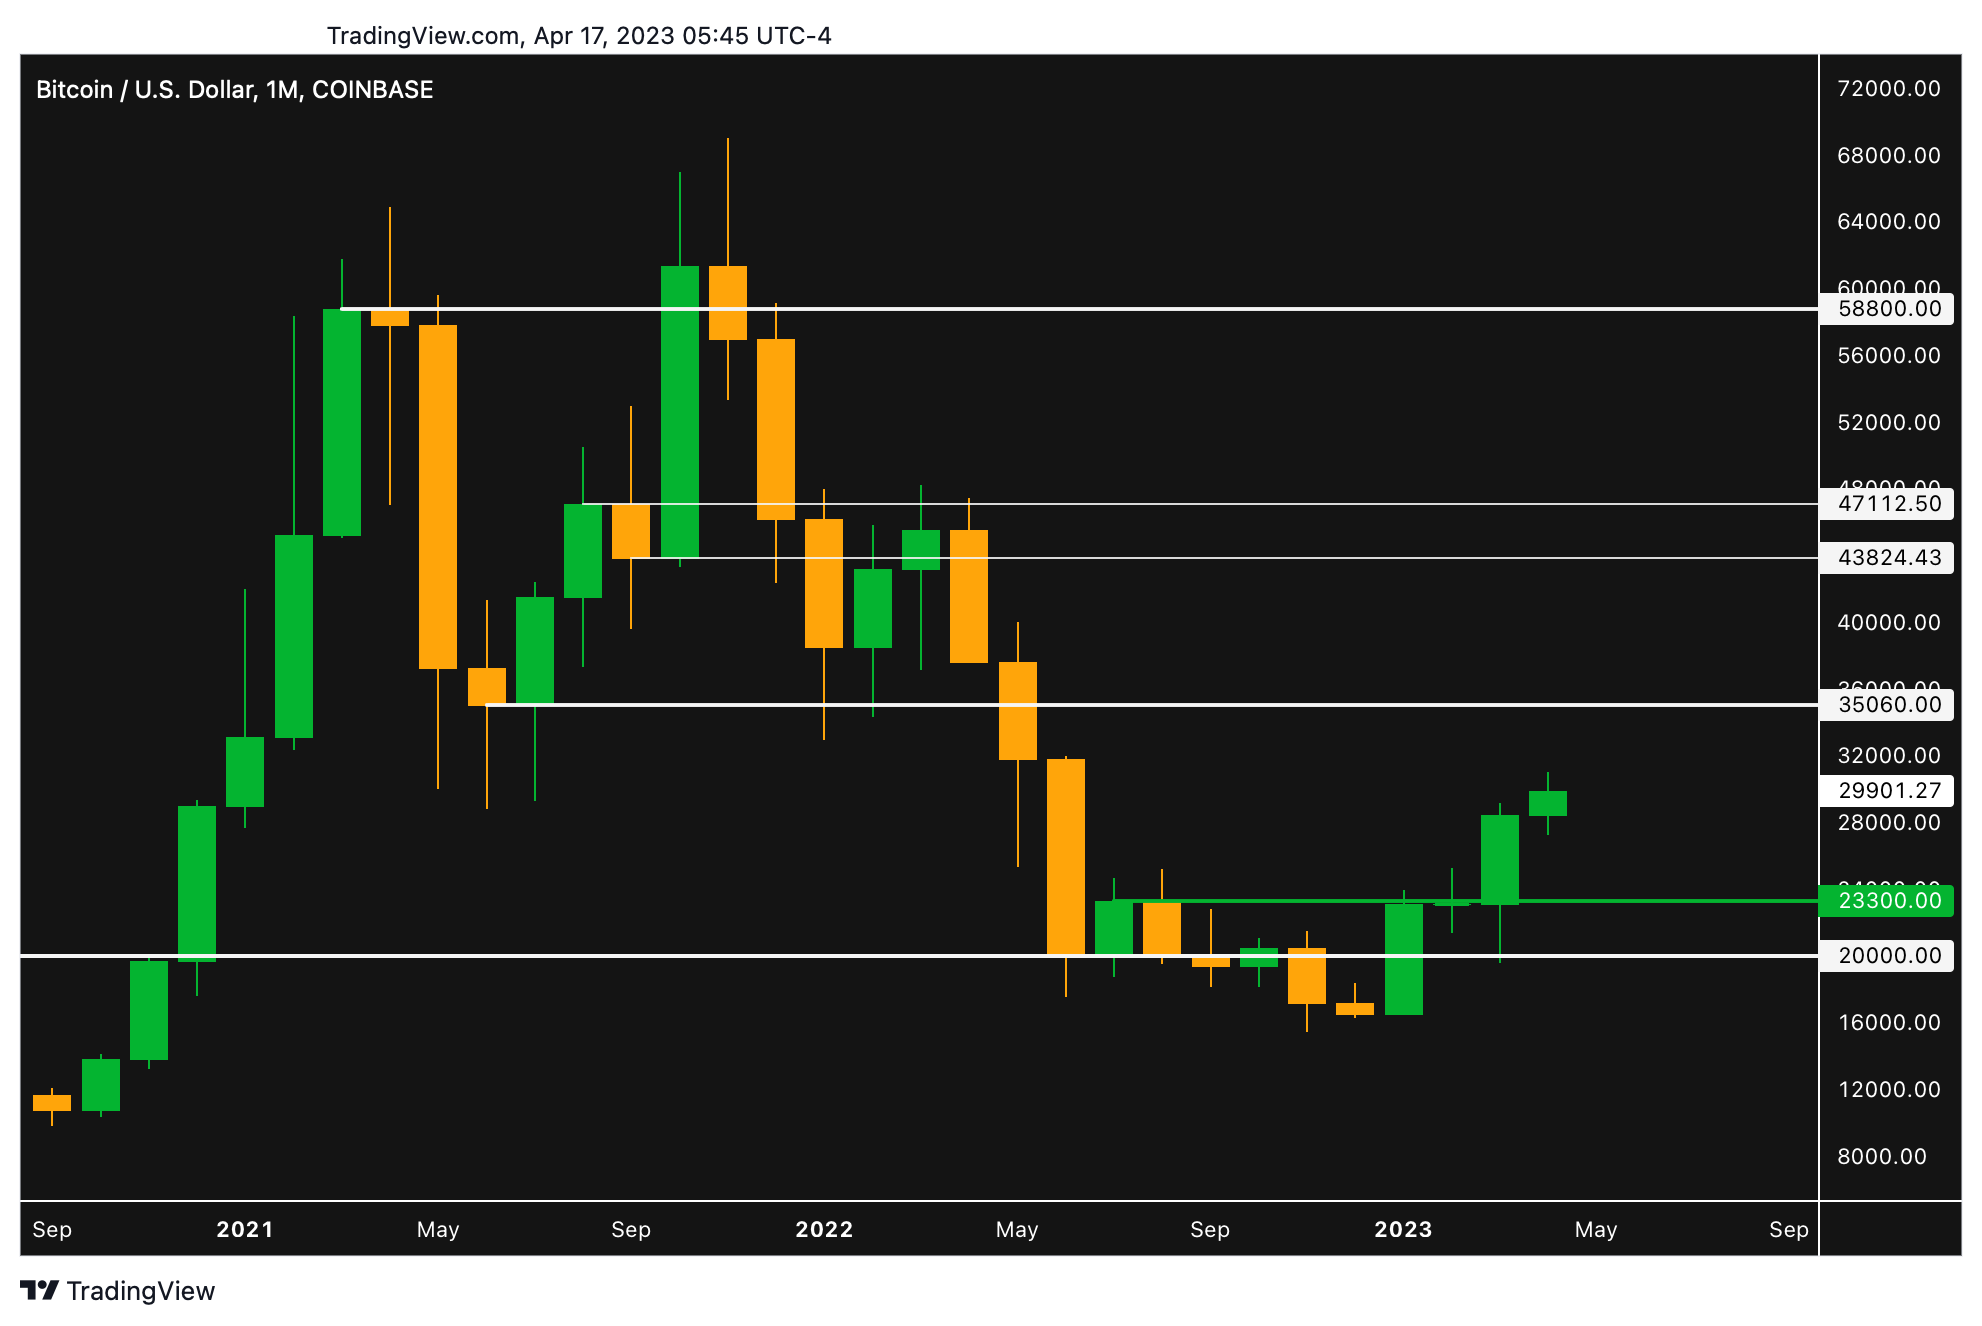
Bitcoin’s monthly chart has been up only for the past four months. In that time, the closest thing we’ve had to bearish price action was in February, which was flat rather than down.
That’s nice, but things don’t typically move up in straight lines without pullbacks.
The monthly chart is currently in no man’s land. It’s not giving me a buy or sell signal.
If Bitcoin can go above the $35K horizontal level, I’d be bullish with a longer-term price target of $58K and a medium-term price target of $45K.
If Bitcoin pulls back to $23.3K, my bull market thesis would remain intact. This dip would be made for buying. If this level does not support price, I’d be concerned.
Bitcoin Medium-Term: At Resistance
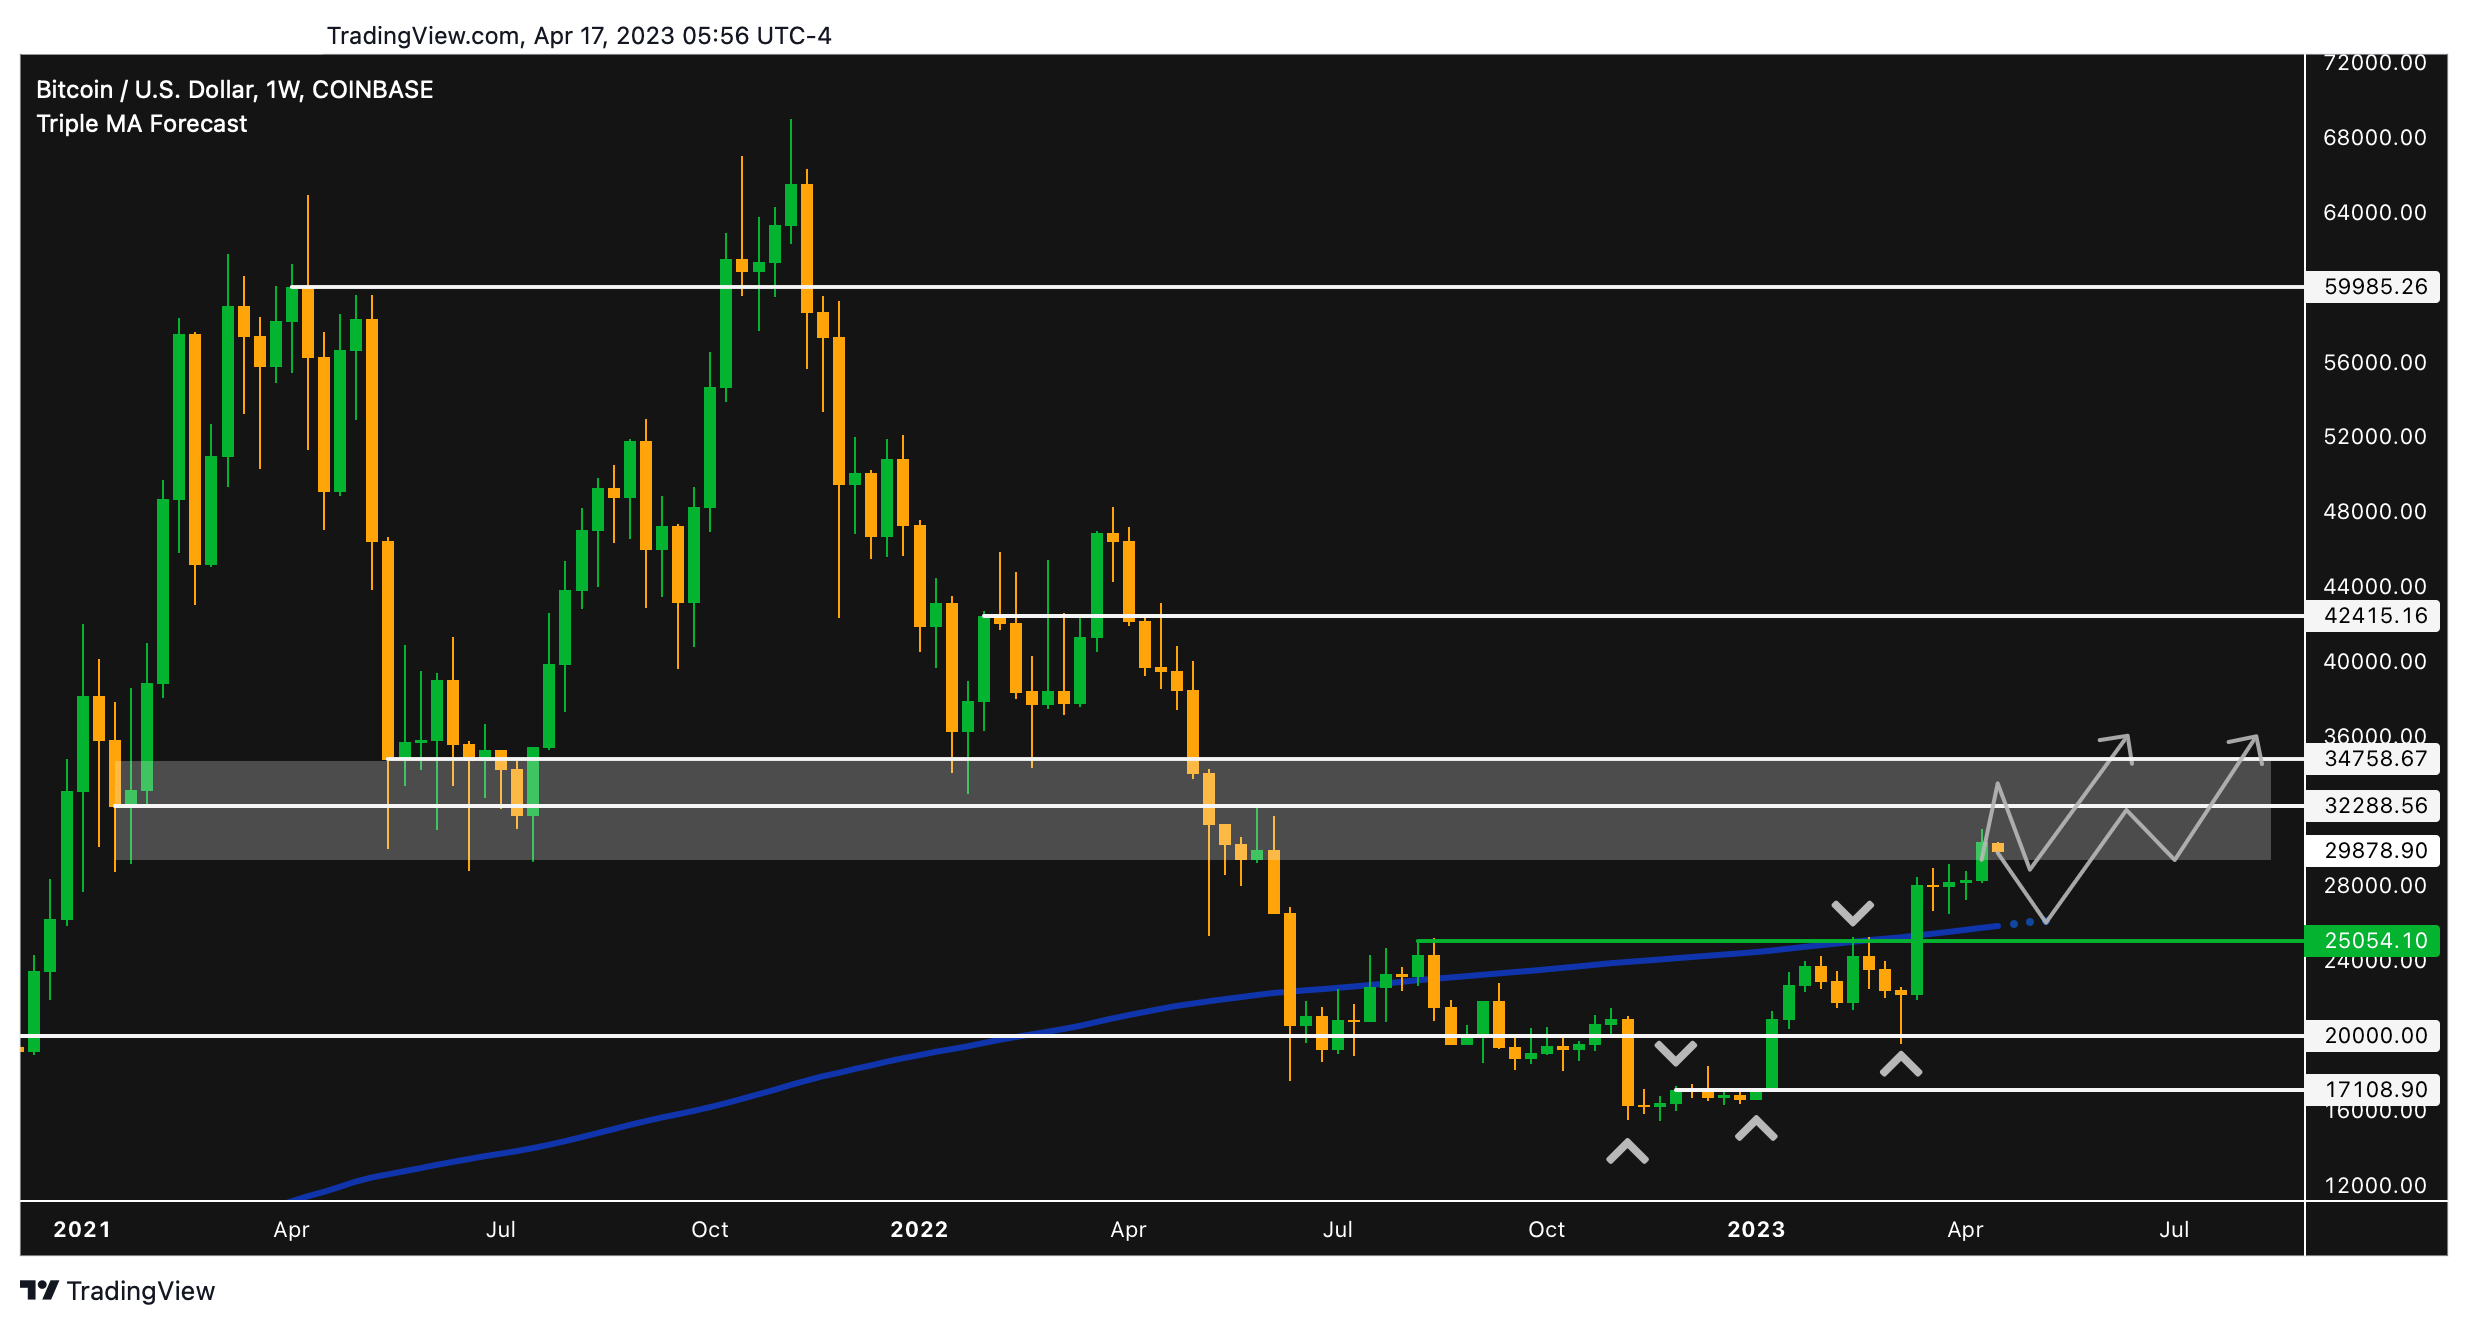
Bitcoin’s weekly chart is long-term bullish because it’s been making a series of higher-highs and higher-lows (it’s in an uptrend) and the 200-week moving average (blue line) is moving up while Bitcoin is above it.
However, it’s currently up against a major resistance zone.
I was expecting continuation of the recent rally—to $32K or higher before a pullback. However, I need to entertain a less bullish scenario where Bitcoin pulls back from here before ultimately breaking through this resistance zone.
A pullback to $25K would be perfectly healthy. If Bitcoin spends much time below $25K, the charts would look pretty bad.
Let’s take a look at the boomer markets because it’s lining up fairly well with Bitcoin.
USD: On The Brink, But at Support
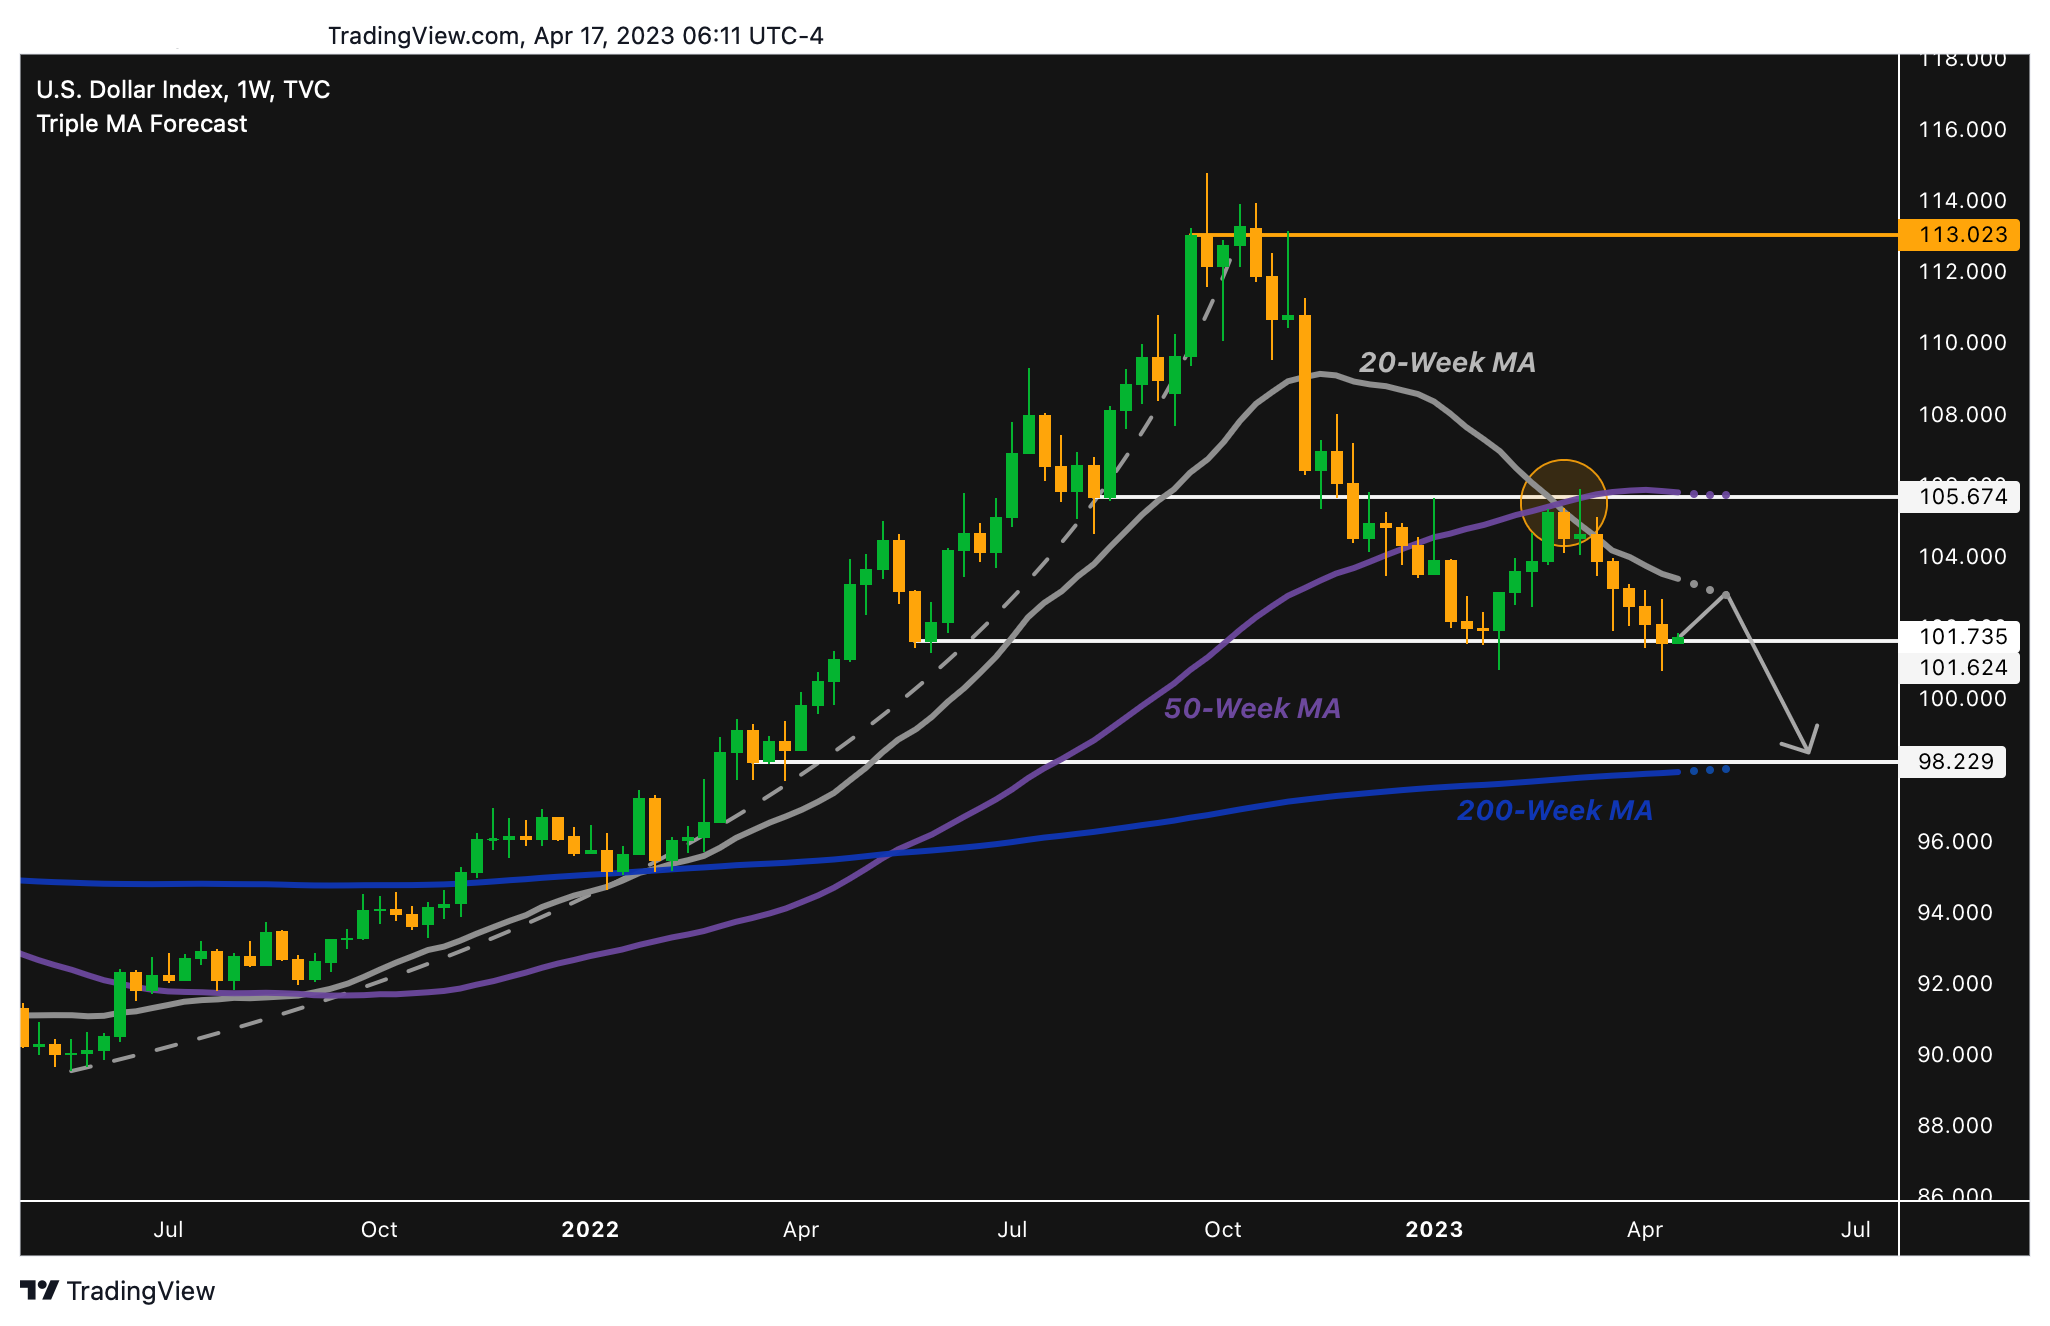
The US dollar index (DXY) has been inversely correlated with Bitcoin.
It’s on the verge of looking super bearish (which would be bullish for Bitcoin), but it’s currently at a support level. This might mean that the Dollar can bounce—and that Bitcoin can pull back—in the short-term.
There’s also a fundamental reason why the Dollar might bounce—because interest rate traders are now less optimistic about the Fed pausing rate hikes than they were previously. Here’s what they’re expecting now:
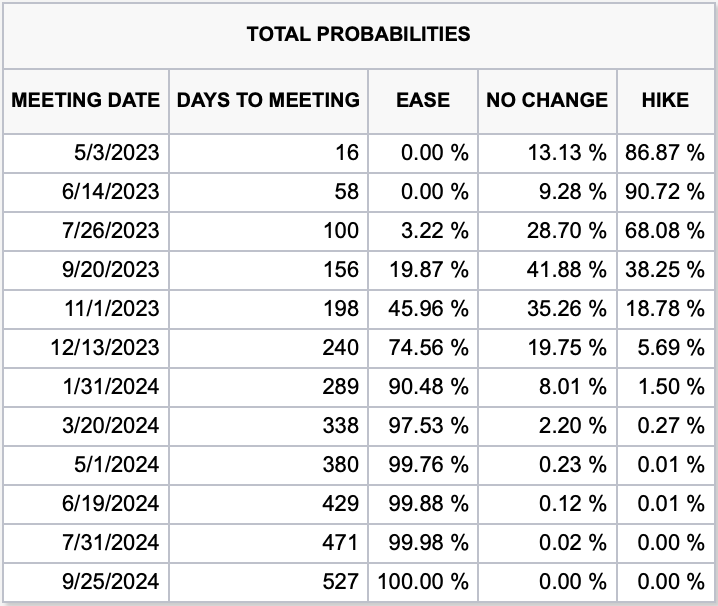
Conversely, if USD breaks down from here, it could be super bullish for Bitcoin.
S&P 500: At Resistance
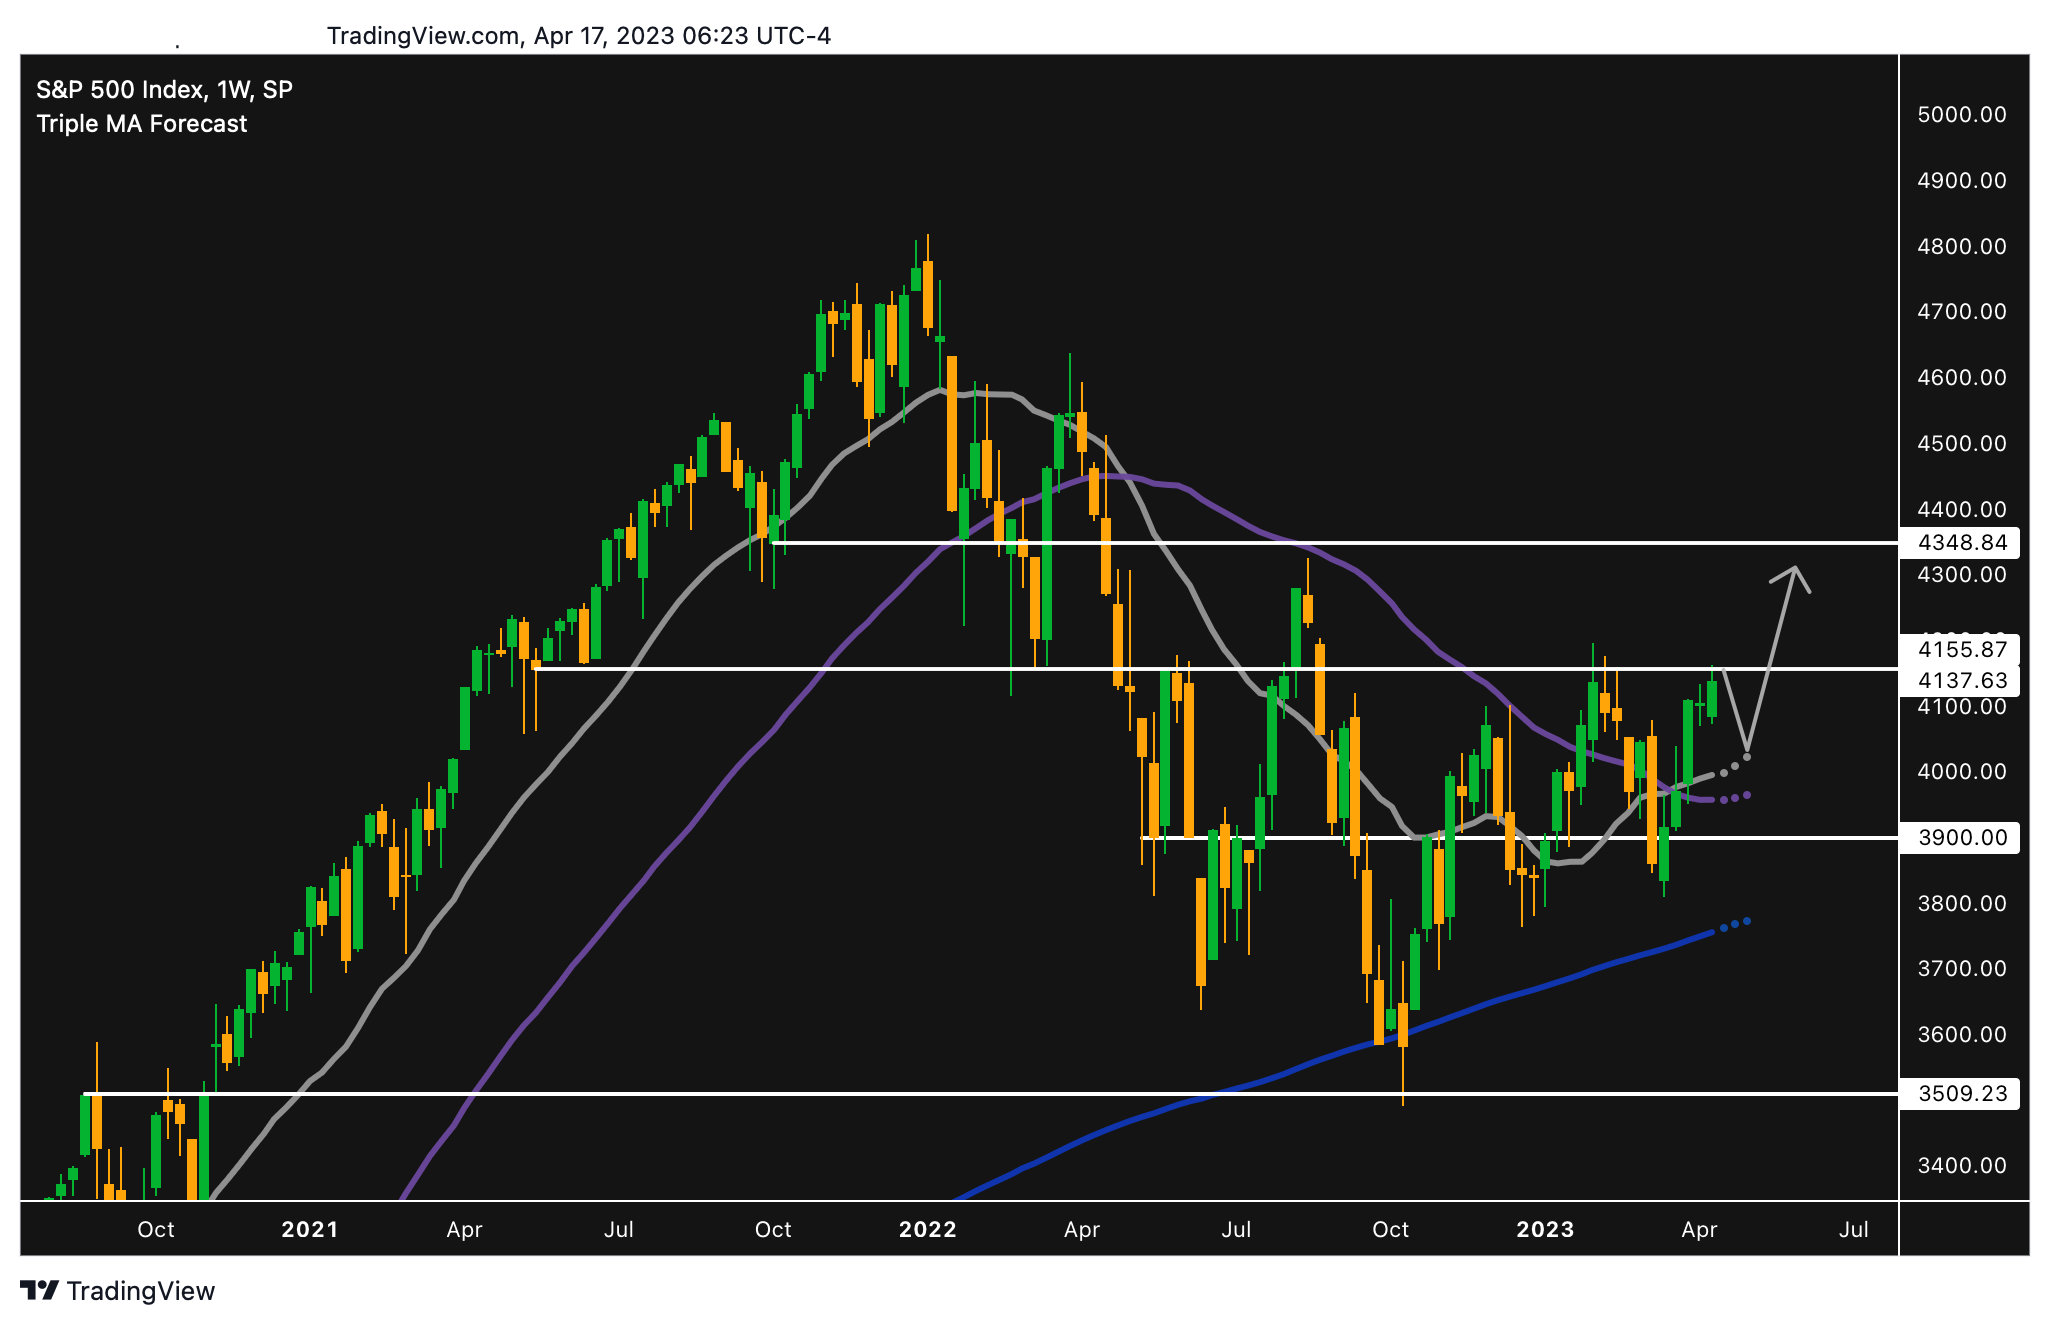
The S&P 500 (SPX) is on the verge of looking quite bullish, but it’s at resistance now. This could mean a small pull back in the short-term before continuation higher.
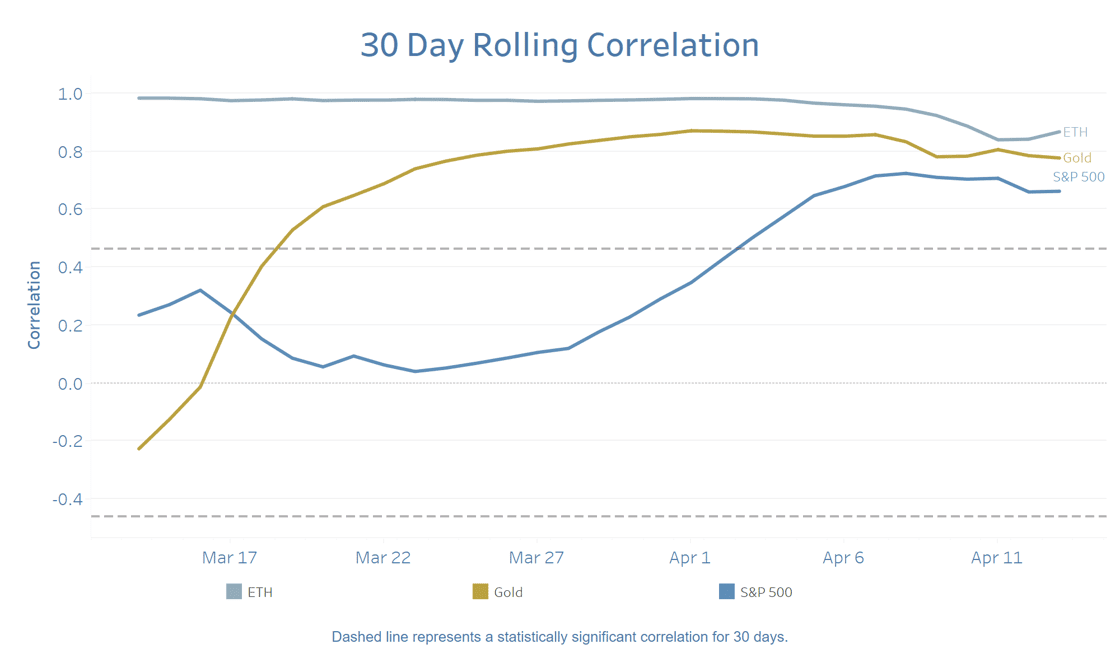
Bitcoin’s correlation with the stock market has returned after decreasing while Bitcoin broke out.
Ethereum: Looks Strong
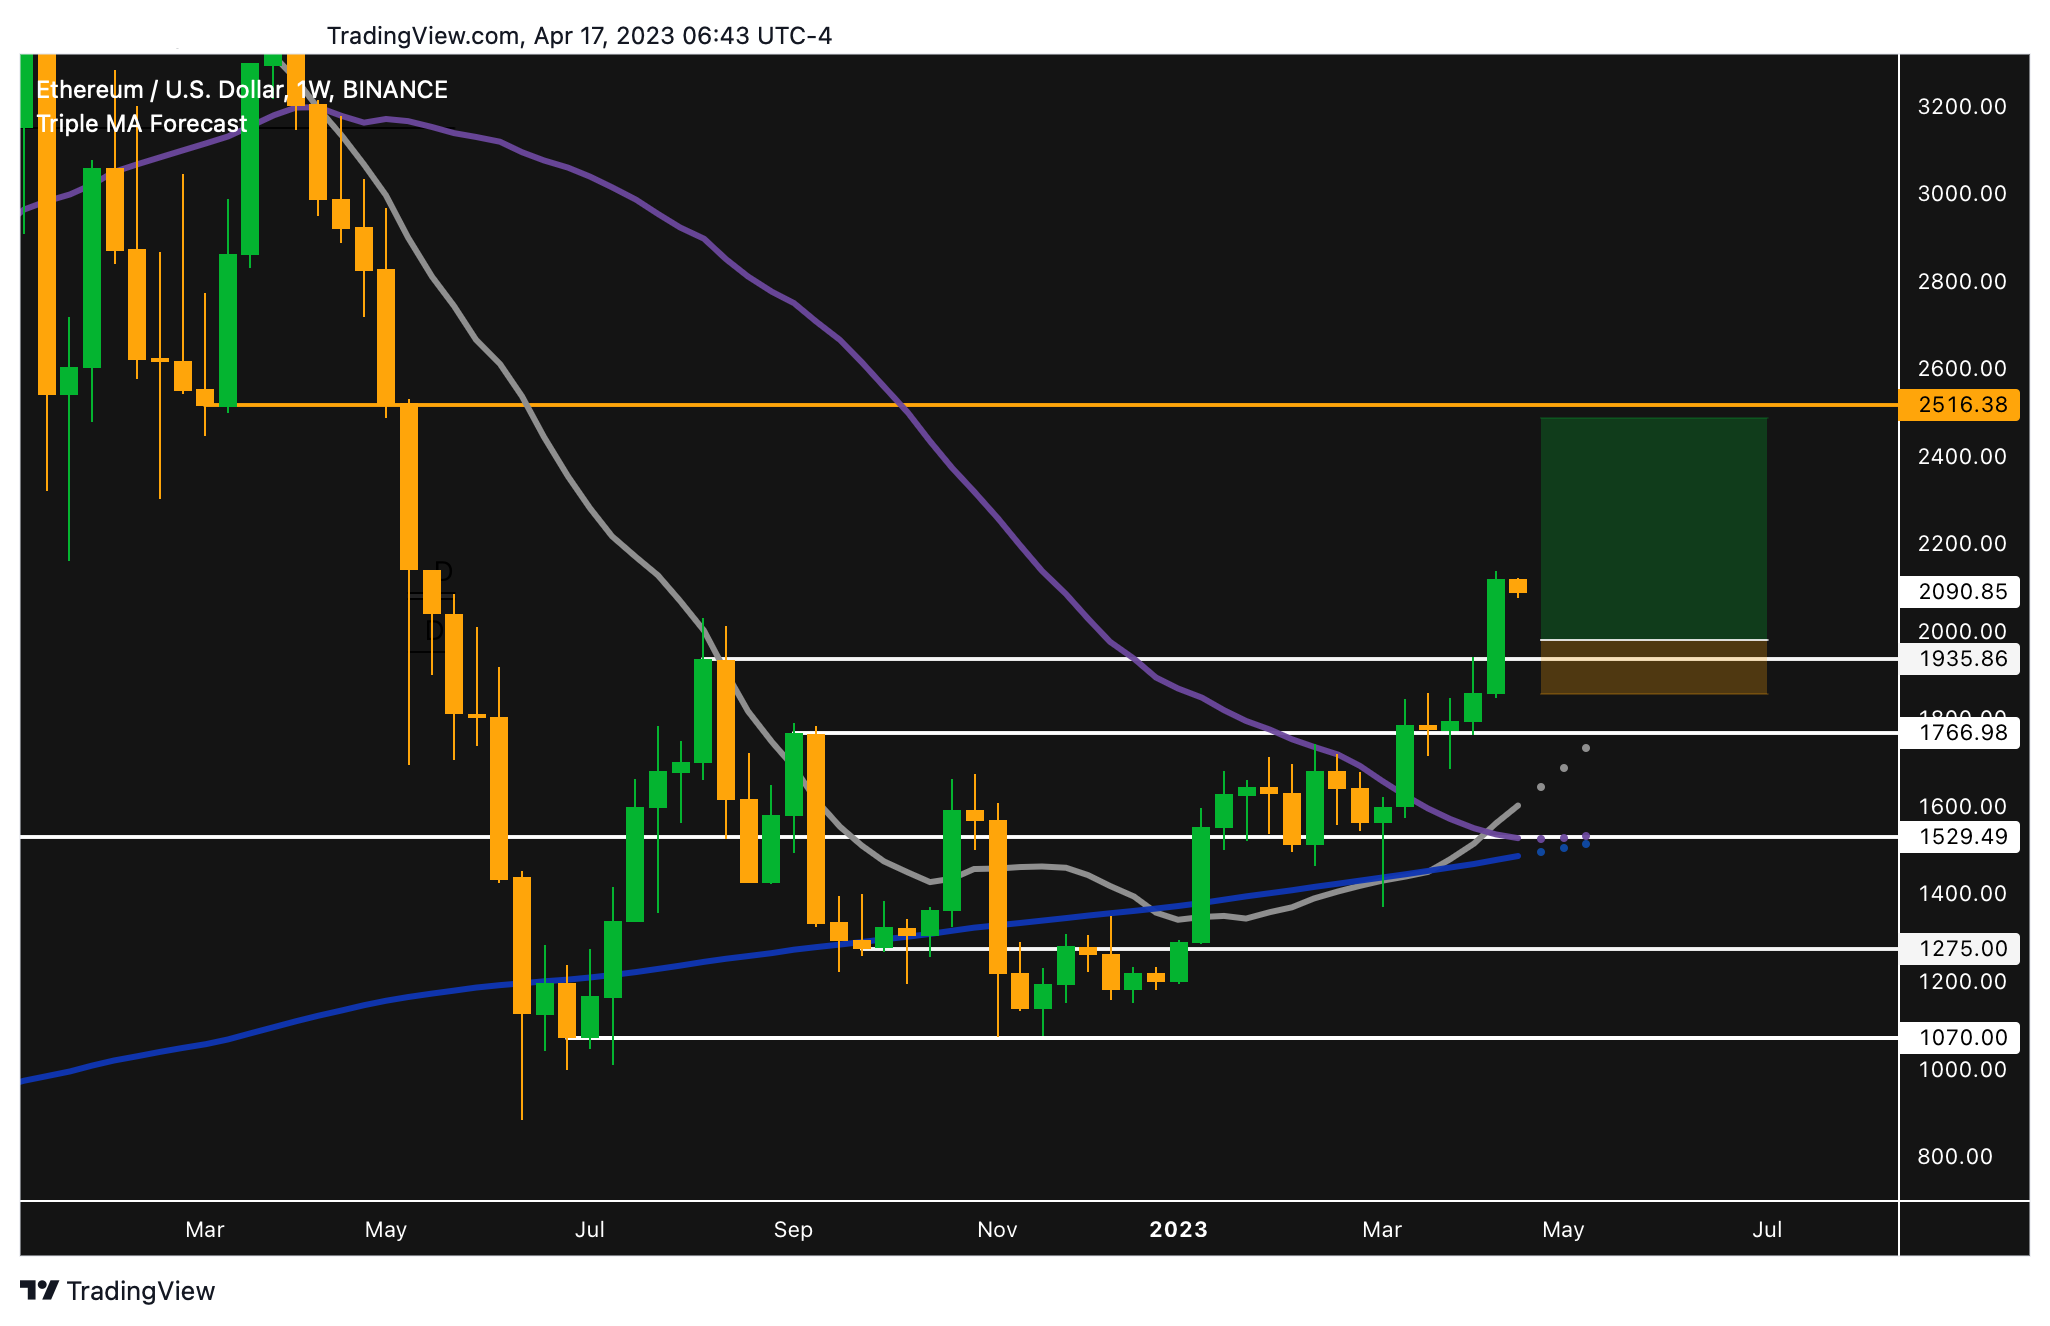
Ethereum broke out last week after the success of its “Shanghai Upgrade”.
Ethereum had been underperforming BTC for months leading up to the upgrade. During this time, the narrative also shifted in Bitcoin’s favor as fears over bank failures and inflation rose.
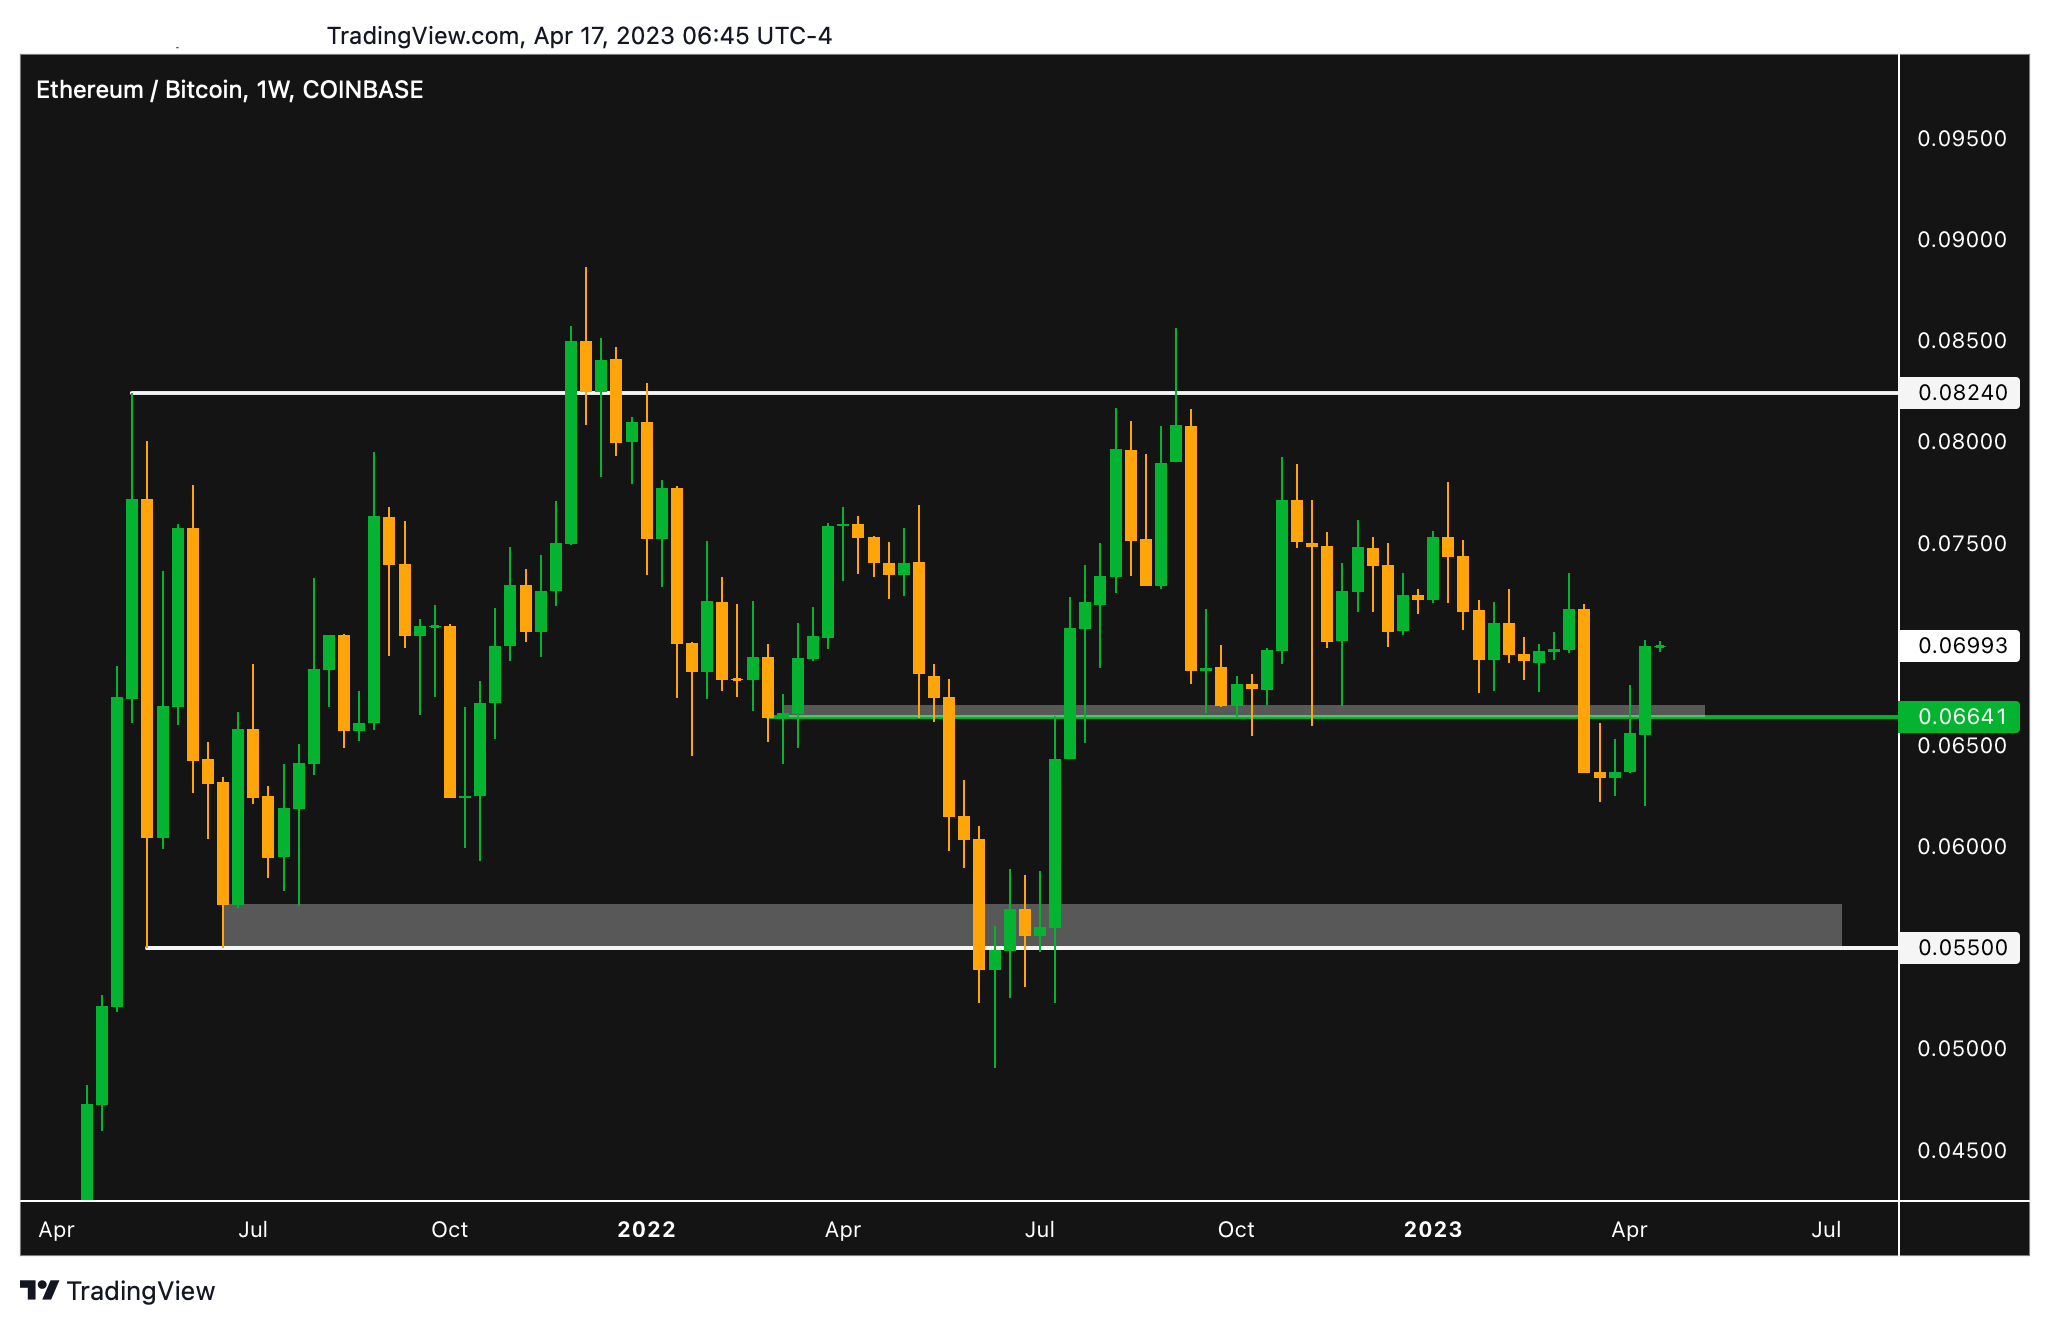
It looks like the Shanghai upgrade was a “sell the rumor, buy the news” event. Ethereum now looks quite strong on both the USD and BTC pair charts.
If Bitcoin pulls back, I might look to buy the dip in Ethereum if it continues to show strength versus Bitcoin.
In summary, I’m leaning bearish in the short-term, but remain bullish in the long-term. I don’t know if Bitcoin will pull back, but I like to think through different possible scenarios, estimate the probabilities of them occurring, and have plan for each.